August 19th, 2013 (Permalink)
Pluto: The Planet that Went to the Dogs
Several years ago, when there was controversy about whether Pluto was a planet, I jumped into the fray despite the fact that I'm not an astronomer (see the Resources, below). In my own defense, the points I was trying to make are not astronomical ones, but matters of logic and philosophy. Good astronomer Phil Plait, who writes the "Bad Astronomy" column for Slate, in today's column says some interesting things about Pluto's planetary status:
Is Pluto a planet, or not? … There exists a somewhat better question: What’s the definition of “planet”? It’s harder to answer than you think. …[A]bove I said that asking what defines a planet is a better question, but it’s still not the best. The real question is, can even we [sic] define what a planet is? I say no. The word “planet” isn’t something we can define (other than “I know one when I see it”, which is only asking for more trouble). It’s a concept. … We don’t have a definition for one, because it’s not a hard and discrete thing. It’s a concept, and it’s pointless to argue over whether say, Greenland is a continent. Instead, it’s a way of quickly categorizing an idea, but it allows some freedom of mind to analyze it. … When you think “planet”, you think “big round ball of stuff orbiting the Sun”, and that’s good enough for me. You can argue over Pluto all you want, but the whole time you do Pluto is sitting out there, a great big (or dinky little, depending on your starting point) world just waiting for us to explore and understand it. That’s good enough for me too. Those objects don’t care what we call them. The important thing is that we go and take a look at them.
I agree with much of what Plait writes here, but some of it is potentially misleading or, at least, unclear. Plait is wrong to suggest that we can't define what "planet" means: of course we can. I think what he's trying to get at is that "planet" is vague, and any precise definition is bound to be arbitrary. At least, that's what I think he means in calling it a "concept", and when he writes that "it’s not a hard and discrete thing". Of course, an actual physical planet such as Pluto is about as "hard and discrete" a thing as you can get; what's not "hard and discrete" is the line between planets and other celestial bodies, such as asteroids and stars.
The vague, common sense concept of "planet" is good enough for me, too, and I've wondered why astronomers think it worth bothering with precisely defining it. It's not obvious to me that anything is riding on whether Pluto is considered a planet or not, or whether there are more or less than nine planets in our solar system. However, I'm not an astronomer so maybe I'm missing something, but the fact that at least one astronomer thinks that it's not an important issue is reassuring.
Source: Phil Plait, "Is Pluto a Planet? That’s a Rap.", Slate, 8/19/2013
Resources:
August 18th, 2013 (Permalink)
Dueling Headlines
Coffee linked to lower risk of death
Coffee linked to premature death, study says
What explains these conflicting headlines? For one thing, they don't concern the same study: the first headline is from a study done last year, and the second is from one done this year. For another thing, the second study concerns a higher rate of premature death only for a subset of coffee drinkers: those who drink four or more cups a day who are less than 55 years of age. However, the headlines still illustrate the difficulty laypeople face in trying to decide what to do based on health news. If one year we start drinking more coffee in order to lower our risk of death, the next year we may have to cut back to avoid premature death.
As I explained last year concerning the first study (see the Resource, below), increasing your coffee consumption in order to gain the supposed benefit of a decreased death risk was not justified based on the study's findings. Nor would be lowering the amount of coffee you drink now based on the more recent study, and for the same reason. Both studies are observational studies that merely show a statistical "link"―as per the headlines―between coffee-drinking and lower or higher rates of death, and neither proves that drinking coffee is what causes these differences.
Sources:
- "Coffee linked to premature death, study says", Fox News, 8/16/2013
- Amina Khan, "Coffee linked to lower risk of death", Los Angeles Times, 5/16/2012
Resource: Java Jive, 5/21/2012
August 12th, 2013 (Permalink)
The Puzzle of the Ex-Presidents
A few years have passed since the police last consulted you about a gang of masked robbers (see the Resources, below), but now they need help with a new case: A gang of six men―one of them was named "Morgan"―wearing masks of former presidents―one wore a mask of President Clinton―robbed a bank. Thanks to the help of an informant, the men were later arrested, but the masks and the stolen money were not found, and each suspect invoked the right to counsel and refused to talk. According to the informant, the robber who wore a mask of President Ford was the only one who knew where the stolen money was hidden. The police set up a line-up of the six suspects in hopes that the informant could identify which one had portrayed President Ford. Here is what the frightened and confused informant said during that line-up:
- Marvin and the man who wore the mask of President George H. W. Bush were at opposite ends of the line-up.
- The man who wore the mask of President George W. Bush was standing right between Keith and the man who wore the Ford mask.
- Dennis was on the right end of the line-up next to the man who wore the Reagan mask.
- The man who wore the Carter mask was right between Oscar and the man who wore the Reagan mask.
- Vern was not standing next to the man at the far left of the line-up.
This is the best the informant could or would do and, as usual, the police are baffled. However, it's possible to determine from the informant's puzzling statements what the police want to know: Which man wore the Ford mask?
Resources:
- The Puzzle of the Dead Presidents, 3/10/2010
- The Puzzle of the Masked Men, 6/28/2009
Acknowledgment (8/13/2013): The original version of this puzzle failed to mention that one of the masks worn by the robbers was of President Clinton. Thanks to Gerald J. Miller for pointing out the omission.
August 7th, 2013 (Permalink)
New Book: An Illustrated Book of Bad Arguments
An Illustrated Book of Bad Arguments is a new book for beginners by Ali Almossawi. So far, it's an entirely online book, but printed copies may be available at some future time. It's short, covering nineteen mostly traditional fallacies and, as indicated by its title, is charmingly illustrated by Alejandro Giraldo. One of the fallacies included is the "No-True-Scotsman" fallacy, so if you're tired of waiting for me to add an entry for it, go read the book.
Source: Ali Almossawi, An Illustrated Book of Bad Arguments, illustrated by Alejandro Giraldo (2013)
August 5th, 2013 (Permalink)
What's New?
I've added a new contextomy to the "Familiar Contextomies" page, which is the second such quote from James Madison. The Founding Fathers are frequent targets for contextomizing by political propagandists, so it's a good idea to be wary when you come across such a quote, especially if a specific source is not cited. Some quotes attributed to them are completely bogus, though this one is just taken out of context so as to mislead.
Update (8/6/2013): I've edited this entry to remove an unnecessary Source: originally, I mentioned Thomas Jefferson in passing and included a link to his famous letter to the Danbury baptists. However, I decided to remove the Jefferson reference but forgot to eliminate the link to the letter. Also, I've added an additional paragraph of explanation to the Exposure section.
August 4th, 2013 (Permalink)
Headline
Your New Doctor Who Is Peter Capaldi
I was told I could keep my old doctor.
August 3rd, 2013 (Permalink)
A Reminder and a Thank You
The Fallacy Files is an Amazon associate. If you value this site and shop at Amazon, please consider doing your shopping by clicking on an Amazon link from any of these pages. By doing so, you support this site at no additional cost to yourself. Thank you for your support!
August 2nd, 2013 (Permalink)
Blurb Watch: The Canyons
The new Lindsay Lohan movie The Canyons has so far received "generally unfavorable reviews", according to Metacritic, where it scores 38 out of 100. Also, it rates a measly 24% on the "Tomatometer" at Rotten Tomatoes, another review averaging site. So, what are the moviemakers to do for blurbs? Here's one from an ad:
"VITAL AND ALIVE. So piercing you can't turn away." -Stephanie Zacharek, THE VILLAGE VOICE
I suppose that "vital" and "alive" are good qualities in a movie, but a train wreck might be "so piercing you can't turn away". Here's the quote in context:
The Canyons Is Vital, Messy, and Alive With RegretA movie can be highly imperfect, stilted, or implausible in all sorts of ways―and still be everything you go to the movies for. The Canyons, Paul Schrader's contemplation of moral decay in Hollywood, is that kind of picture, in some places so crazy-silly you want to laugh and in others so piercing you can't turn away.
I guess that Zacharek liked the movie, or is at least recommending it, though it's hard to tell since she doesn't use stars or some other rating system that I can find. At any rate, the review seems to be more ambivalent about the movie than the blurb suggests, which leaves out the "messy" between "vital" and "alive", and leaves out the ellipsis as well.
Finally, here's an official Fallacy Files carb-free, 100% natural, free-range unBlurb:
"MESSY. Highly imperfect, stilted, implausible in all sorts of ways. The Canyons is that kind of picture, in some places so crazy-silly you want to laugh."
―Stephanie Zacharek, The Village Voice
Sources:
- Ad for The Canyons, The New York Times, 8/2/2013, p. C13
- Stephanie Zacharek, "The Canyons Is Vital, Messy, and Alive With Regret", The Village Voice, 7/31/2013

August 1st, 2013 (Permalink)
Charts & Graphs: The One-Dimensional Pictograph
While they are informative, bar charts look bland, so people are always looking for ways to spruce them up. One way that we've already looked at (see the Previous Entries, below) is to add a third dimension, but another way is to replace the boring bars with pictures. So, if you're making a graph on, say, how much money the USDA spends on conferences each year (see the Resource, below), instead of a dull bar representing the amount of money spent in a year, why not use a picture of a pig? Or, if you want a chart that compares the yield in tons of TNT of nuclear bombs, replace the unimaginative bars with mushroom clouds (see the example).
Of course, there's nothing wrong with trying to make a boring graph look better, but replacing bars with pictures should not create a misleading impression. In a bar chart, it's the height of the bars that conveys information, and the width of the bars should not vary. However, when pictures replace bars, whether they are pictures of pigs or mushroom clouds, the artist will be tempted to preserve the proportions of the objects portrayed, and the widths of the pictures will increase with their heights. This can easily exaggerate the differences between the columns in the chart, since the viewer is likely to compare the areas of the pictures rather than they're heights. Thus, a picture which is twice the height of a similarly-proportioned picture will appear four times as large.
For instance, look at the clouds labelled "Mike" and "Bravo" in the example: according to the scale at the left, Mike was about a 10 megaton explosion, while Bravo was around fifteen. So, the height of Bravo is half again that of Mike, but its area is more than double, and Bravo will appear more than twice the size of Mike to the casual viewer. Moreover, as Darrell Huff points out (see the Source, below), when three-dimensional objects are portrayed, we may tend to compare their sizes based not on area but on volume, so that Bravo would appear more than three times the size of Mike.
So, don't replace the bars in a bar chart with pictures of objects unless you can keep the widths of the objects fixed while changing their heights. Otherwise, you risk fooling your audience, which is naughty.
Sources:
- Eronarn, "Imagine A Pie Chart Stomping On An Infographic Forever", Smashing Magazine, 5/10/2010
- Darrell Huff, How to Lie with Statistics (1954), Chapter 6
Resource: Charts & Graphs, 9/25/2012
Previous Entries in this Series:
- The Gee-Whiz Line Graph, 3/21/2013
- The Gee-Whiz Bar Graph, 4/4/2013
- Three-Dimensional Pie, 5/5/2013
- The 3D Bar Chart, Part 1, 6/3/2013
- The 3D Bar Chart, Part 2, 7/11/2013
July 31st, 2013 (Permalink)
Headline
San Diego mayor didn't get sexual harassment training, lawyer says
He learned by doing?
July 26th, 2013 (Permalink)
Check it Out
Why does so much research turn out to be wrong? Why is it that a study comes out claiming that coffee causes cancer, then a later report says that coffee prevents cancer? Statistician Andrew Gelman has an article focusing on a study that makes the rather ridiculous claim that women are more likely to wear red clothing when they are fertile, but this is just an example of what can go wrong, including in studies of more plausible hypotheses.
One reason, according to Gelman, is the multiple comparisons fallacy:
The standard in research practice is to report a result as “statistically significant” if its p-value is less than 0.05; that is, if there is less than a 1-in-20 chance that the observed pattern in the data would have occurred if there were really nothing going on in the population. But of course if you are running 20 or more comparisons (perhaps implicitly, via choices involved in including or excluding data, setting thresholds, and so on), it is not a surprise at all if some of them happen to reach this threshold.
One thing that Gelman doesn't mention, though it's implicit in his discussion of Bem, is that replication is not an optional part of the scientific method. The history of parapsychology is the history of studies like Bem's: every so often a new one comes along, there's excitement, and it's touted by proponents as proof of ESP; but no one can replicate it, eventually it's forgotten, and then another new study comes along―and the process begins anew. This is why parapsychology remains a pseudoscience and not the real thing.
I think that Gelman's last sentence is potentially misleading: "The system of scientific publication is set up to encourage publication of spurious findings." There are definitely some perverse incentives in academia, including the pressure to "publish or perish" which encourages quantity of publications over quality. So, Gelman could have more accurately written: The system of scientific publication is set up to encourage publication, including spurious findings.
Moreover, some of the mechanisms that should weed out the spurious findings don't work as well as they ought: Peer review tends to be a thankless job and, therefore, superficial. Journals are biased in favor of publishing positive results rather than negative ones, including failures of replication. As a result, there are far too few attempts made to replicate studies, and those that are made may not get published.
Moreover, we don't know how many studies fail to achieve statistically significant results and are simply filed away―"the file drawer effect". If nineteen studies showed no statistically significant relationship between red clothes and fertility, then there would be no surprise that a twentieth did so. Of course, it's unlikely that there are any other studies done of this particular hypothesis, but how many have been done on coffee and cancer?
Source: Andrew Gelman, "Too Good to Be True", Slate, 7/24/2013
July 23rd, 2013 (Permalink)
The History of "the Reverse Mussolini Fallacy"
I like The Volokh Conspiracy and frequently point readers to articles from it, but the conspirators sometimes step out of their areas of expertise in the law to moonlight as logicians or linguists. Many years ago, head conspirator Eugene Volokh named what he called "the Reverse Mussolini Fallacy" (RMF), and I pointed out at the time that this was actually a new name for the old fallacy of Guilt by Association (GbA). Now, conspirator Ilya Somin writes (see the Source, below): "One of senior Conspirator Eugene Volokh’s cleverest inventions is the Reverse Mussolini Fallacy."
Just to try again to set the record straight (see the Resource, below, for the first attempt), Volokh did not "invent" the fallacy of GbA, he just renamed it "the Reverse Mussolini Fallacy". That's fine, as far as it goes, though I don't like the name for reasons that I explained in the previous entry on this subject. However, that's a matter of taste, and others might like it, but to give something a new name―no matter how clever―is not to "invent" it.
The Fallacy Files entry for GbA goes back to the beginning of this website in 2001, at least four years before Volokh wrote his original entry, but even I didn't "invent" the fallacy. I'm not sure who was actually the first person to recognize it, but it wasn't Volokh unless there is a different, earlier source. The Source that I cited in the entry was the third edition of T. Edward Damer's textbook Attacking Faulty Reasoning, which was published in 1994, over ten years before Volokh's post on RMF. Here's how Damer defines it in his section on "Assigning Guilt by Association":
This fallacy involves the manipulation of negative feelings, by pointing out that the opposing view is held by people or groups we don't like or don't usually agree with. This appeal encourages one to accept the arguer's position in order to avoid any guilt by association with those held in such negative esteem. (P. 54)
This is highly general, but notice that it is a description of GbA as a logical fallacy rather than the common, confusing usage in which "guilt by association" refers to accusing or suspecting someone based on social relationships. In the logical sense, it is not GbA to accuse someone of being a fascist because that person associates with fascists. Rather, it would be GbA, in the logical sense, to reject a view just because it is held by some fascist, which is why rejecting punctual trains because of Mussolini is an example of GbA.
Michael Labossiere's work on fallacies, still available at The Nizkor Project, includes a page on the fallacy using the "Guilt by Association" name. The page (see the Source, below) goes back at least to 1997, but is copyrighted 1995. Here's Labossiere's second example, which is clearly the type of reasoning that Volokh was labelling "the Reverse Mussolini Fallacy":
Jen and Sandy are discussing the topic of welfare. Jen is fairly conservative politically but she has been an active opponent of racism. Sandy is extremely liberal politically.Jen: "I was reading over some private studies of welfare and I think it would be better to have people work for their welfare. For example, people could pick up trash, put up signs, and maybe even do skilled labor that they are qualified for. This would probably make people feel better about themselves and it would get more out of our tax money."
Sandy: "I see. So, you want to have the poor people out on the streets picking up trash for their checks? Well, you know that is exactly the position David Count endorses."
Jen: "Who is he?"
Sandy: "I'm surprised you don't know him, seeing how alike you two are. He was a Grand Mooky Wizard for the Aryan Pure White League and is well known for his hatred of blacks and other minorities. With your views, you'd fit right in to his little racist club."
Jen: "So, I should reject my view just because I share it with some racist?"
Sandy: "Of course."
That's the best that I can do in describing the history of the fallacy, since neither Damer nor Labossiere supply citations to sources, and the trail goes cold around the mid-'90s. My guess is that there are earlier sources, but I haven't found any so far. If you know of an earlier reference, please let me know.
Sources:
- T. Edward Damer, Attacking Faulty Reasoning: A Practical Guide to Fallacy-Free Arguments (3rd edition; 1994), pp. 54-56.
- Michael C. Labossiere, "Fallacy: Guilt By Association", The Nizkor Project (1995). This is the Internet Archive's version of the page from 1997.
- Ilya Somin, "The Reverse Mussolini Fallacy and Conservative/Libertarian Reactions to PC Excesses", The Volokh Conspiracy, 7/22/2013.
Resource: Don't Name that Fallacy!, 12/2/2005
July 21st, 2013 (Permalink)
Book Review: Deadly Choices
Earlier this month (see Resource 2, below), in the course of pointing to his new book, I mentioned that I had read Paul Offit's previous book Deadly Choices. So, here's a brief review of it, a little late maybe but better than never:
| Title: | Deadly Choices | |
| Subtitle: | How the Anti-Vaccine Movement Threatens Us All | |
| Author: | Paul A. Offit | |
| Date: | 2010 | |
| Quote… | In the early 1900s, children routinely suffered and died from diseases now easily prevented by vaccines. Americans could expect that every year diphtheria would kill twelve thousand people, mostly young children; rubella (German measles) would cause as many as twenty thousand babies to be born blind, deaf, or mentally disabled; polio would permanently paralyze fifteen thousand children and kill a thousand; and mumps would be a common cause of deafness. Because of vaccines, all these diseases have been completely or virtually eliminated. But now, because more and more parents are choosing not to vaccinate their children, some of these diseases are coming back. How did we get here? How did we come to believe that vaccines, rather than saving our lives, are something to fear? (P. xviii) | …Unquote |
| Review: | This is not a book about logical fallacies, but a book that reveals the consequences of fallacious thinking. As a result, it contains examples of fallacies and of their often deadly effects. If you've ever wondered where's the harm in the kind of pseudoscientific thinking and conspiracy theories that have led people to skip or delay vaccination, this book offers a case study. How did we get here? These are the main fallacies implicated: | |
- Post Hoc: It's no accident that the diseases that vaccines are blamed for are ones usually diagnosed in early childhood:
The important question…was whether the vaccine could cause permanent harm, such as epilepsy and mental retardation. Answering this question isn't as easy as it seems. That's because every year in the United States, in England, and throughout the world, children suffer epilepsy and mental retardation; this has been true for centuries, well before the pertussis vaccine was invented. Also, symptoms of epilepsy and retardation often occur in the first year of life, the same time that children are receiving three doses of vaccine. Given the widespread use of pertussis vaccine, most children destined to develop seizures or mental retardation anyway would likely have received it, some within the previous twenty-four or forty-eight hours. So, the only way to figure out whether the vaccine was the problem was to study thousands of children who did or didn't get it. If the vaccine were responsible, the risk of epilepsy or retardation would be greater in the vaccinated group. (P. 28)
Parents of children who have seizures, or are diagnosed as epileptic or autistic after being vaccinated, may feel convinced by this coincidence that the vaccine caused the illness, but you just can't tell that way. It's reasonable to form a hypothesis that the vaccine caused the disease, but that hypothesis must then be tested scientifically to establish causation. As Offit explains, the hypotheses that vaccines cause epilepsy or autism have been tested and have failed the tests.
- Appeal to Nature: The notion that it's unnatural to vaccinate people is one of the most common arguments against it. This is ironic since vaccination may be the most natural way of fighting disease, because it trains the body's own defenses to recognize and be able to fight infections. Here's a nineteenth-century anti-compulsory vaccination activist:
"Stay then the hand of the vaccinator," he wrote. "…Let Britannia put her foot on this iniquitous destroying, death-producing interference with nature's laws and crush it out." (P. 109)
And here's a twenty-first century one:
[Barbara Loe] Fisher also argued that natural infection is better than immunization. "Experiencing infectious disease, … has been part of the human condition since man has walked the earth…. Why do vaccinologists insist on assuming that the human immune system is incapable of dealing with that experience? Or benefiting from it?" (P. 76)
And man has been dying from many of those diseases since he has walked the earth, at least until quite recently thanks to vaccination. Of course, death is natural, too.
- Appeal to Celebrity: Offit discusses several celebrities who have contributed to the crusade against vaccination. Jenny McCarthy is the most infamous, together with her former boyfriend Jim Carrey. Now McCarthy is apparently going to be the new co-host of the silly TV show The View, which previously gave the slot to conspiracy theorist Rosie O'Donnell (see Resource 1, below), so it's not exactly an unprecedented move.
In a telling anecdote about the media and celebrity, Offit recounts how McCarthy refused to appear on an episode of the television show The Doctors with a representative of the American Academy of Pediatrics (AAP):
…[I]n The Doctors program [Travis] Stork revealed how, on the strength of McCarthy's star power, she had rigged the show.
MCCARTHY: Go call the AAP…and see if they'll sit down with us and they'll say, 'No….'
STORK: Let me just say this openly to everyone. You know, we wanted to have someone from the AAP here today, but you refused to allow them to come. So if you want to engage them in a debate, they would have been here.
…[Jenny] McCarthy is a celebrity. It's her celebrity that has landed her on shows like Oprah and Larry King Live. And it's her celebrity that has enabled her to determine the guest list. (Pp. 156-157, 162)
It's good that Stork called McCarthy on her dishonesty, but why did the show agree to have her on at all, let alone allow her to dictate who else would appear? Obviously, it's for the same reason that The View would offer her a co-hosting gig.
In addition to McCarthy, there's the comedian, talk-show host, and alleged "skeptic" Bill Maher. If Maher is a skeptic, I'm McCarthy's new boyfriend. Maher is so ignorant that he thinks that vaccination means "stick[ing] a disease into your arm", yet he calls other people "idiots" for getting vaccinated (p. 165).
Of course, there's no reason why former Playboy bunnies or comedians should know anything much about vaccination, but there's also no reason why we should pay any heed to their opinions about it.
Resources:
- Silly Celebrity, Too, 3/31/2007
- New Book: Do You Believe in Magic?, 7/10/2013
July 19th, 2013 (Permalink)
Blurb Watch: Blackfish
An ad in The New York Times for the new documentary Blackfish shows four stars from its review by Time Out New York, which uses a five-star system. Many potential moviegoers may not know this fact and think that it is the highest rating possible. We've seen this before many times (see the Previous Blurb Watches, below), and Carl Bialik even mentioned it in passing in his "The Numbers Guy" column on movie rating scales. Time Out NY used to use a six-star scale, but they dropped one star a few years ago for some reason.
In the same ad, there is the following blurb:
"STIRRING. A vital, convincing proponent for the greater protection and understanding of such evolved and majestic creatures."-LOS ANGELES TIMES
The blurb leaves something out of the full context of the quote and doesn't even bother to indicate the omissions with ellipses:
The stirring documentary "Blackfish" vividly tracks the thorny case of Tilikum, a 12,000-pound killer whale and longtime SeaWorld Orlando attraction responsible for three deaths over the course of several decades in captivity. … Since SeaWorld declined to comment here…"Blackfish," named after the Native American term for orcas, remains decidedly one-sided. But when that "side" is such a vital, convincing proponent for the greater protection and understanding of such evolved and majestic creatures, it can't help but win.
Obviously, the adwriter was also a bit one-sided.
Sources:
- Ad for Blackfish, The New York Times, 7/19/2013, p. C13
- Carl Bialik, "Let's Rate the Ranking Systems of Film Reviews", The Numbers Guy, 1/23/2009
- Gary Goldstein, "Review: 'Blackfish' and the thorny captivity of a killer whale", Los Angeles Times, 7/17/2013
- Joshua Rothkopf, "Blackfish: movie review", Time Out New York, 7/16/2013
Previous Blurb Watches:
- The Year My Parents Went on Vacation, 4/11/2008
- The Informers, 4/24/2009
- In the Loop, 8/14/2009
- The Eagle, 2/25/2011
- Lockout, 4/21/2012
July 11th, 2013 (Permalink)
Charts & Graphs: The 3D Bar Chart, Part 2
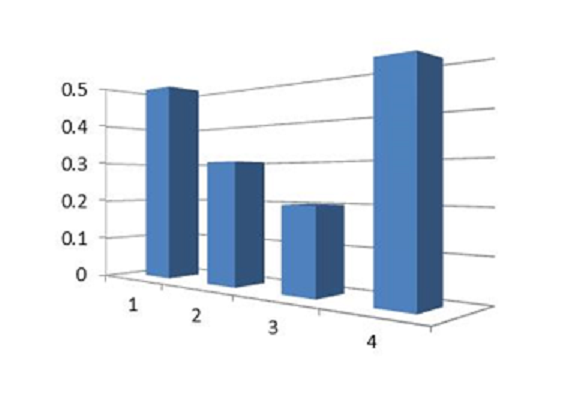
In Part 1 of these entries on how three-dimensional bar charts can be misleading (see Previous Entry 4, below), we saw that an overhead perspective given to such a chart can exaggerate the heights of its bars. In addition to rotating such a chart on its x-axis, it's also possible to rotate it on its y-axis in such a way as to make one side of the chart appear closer to the viewer than the other. See the chart to the right for an example.
A quick glance at this chart is likely to give the impression that the fourth bar is taller than the first, because the fourth appears closer than the first in the graph's perspective, and therefore looms larger. However, a closer look will show that both bars represent the same value: .5. As we've seen with other 3D graphs, the extra dimension adds no new information, so it can only be justified on the grounds that the additional dimension makes the graph prettier or more striking.
The chart shown is one created to be an example of this effect, rather than one captured "in the wild". I prefer, when possible, to use real-life examples, but in this case I was not able to find a good one. This is some evidence that this type of misleading chart may be uncommon, and probably less common than the types we've seen previously.
As I've mentioned in previous entries, there's no rule against making bar charts three-dimensional, or rotating them on the y-axis, but it's important to keep in mind the possibility of distorting the apparent relative sizes of the bars in doing so.
Source: "Misleading graphs", BBC
Previous Entries in this Series:
- The Gee-Whiz Line Graph, 3/21/2013
- The Gee-Whiz Bar Graph, 4/4/2013
- Three-Dimensional Pie, 5/5/2013
- The 3D Bar Chart, Part 1, 6/3/2013
Next Entry in this Series: The One-Dimensional Pictograph
July 10th, 2013 (Permalink)
New Book: Do You Believe in Magic?
Dr. Paul Offit, whom I've mentioned in passing a couple of times previously (see the Resources, below), has a new book out titled: Do You Believe in Magic? The Sense and Nonsense of Alternative Medicine. I've just laid hands on a copy, so I haven't read it yet, but I have read and recommend his previous book Deadly Choices, which is a good answer to the question: Where's the harm?
What can we expect from Offit's new book? A lot of the appeal of "alternative" medicine is based on the notion that it is somehow more "natural" than what it's alternative to, though it's hard to see what's so natural about coffee enemas or taking lots of vitamin pills. Unsurprisingly, Part II of the book is titled: "The Lure of All Things Natural".
Another thing that wouldn't be surprising is some silly celebrity sightings, which brings us to Part IV: "When the Stars Shine on Alternative Medicine", with chapters on Suzanne Somers and Jenny McCarthy. The mother of all silly celebrities, Oprah Winfrey, puts in an appearance on the first page of chapter one!
What other tricks do the advocates of alternative medicine have up their sleeves? You'll have to read the book to find out!
Resources:
- Paul A Offit, Deadly Choices: How the Anti-Vaccine Movement Threatens Us All (2012)
- Silly Celebrities of the World, Unite!, 5/6/2009
- Where's the harm?, 2/21/2013
Fallacies:
July 4th, 2013 (Permalink)
A Fireworks Puzzle
Four young friends―one is named David―went to a store to buy fireworks for the annual Fourth of July picnic celebration of their families―one of which has the last name Glenn. Each child was given enough money to buy three different types of fireworks, and each did so but no two bought exactly the same three. Their parents wisely limited their purchases to four types of fireworks: sparklers, snappers, whistlers, and black snakes. Brian and the Harris child, who isn't Amy or Clara, both bought sparklers and whistlers. The Edwards child, who isn't Amy, bought both whistlers and black snakes, but the Flynn child bought only one of these types of fireworks. Clara bought some sparklers. What is Clara's last name?
Update (7/17/2013): Just to be clear, the first names of the four children are, in alphabetical order: Amy, Brian, Clara, and David.
June 30th, 2013 (Permalink)
Headline
Hospitals Are Sued By 7 Foot Doctors
Did they keep hitting their heads?
Source: Robert Goralski, Press Follies: A Collection of CLassic Blunders, Boners, Goofs, Gaffes, Pomposities, and Pretentions from the World of Journalism (1983)
June 29th, 2013 (Permalink)
A Literacy Puzzle
Spell backwards, forwards.
June 19th, 2013 (Permalink)
The Million Straw Man March
The first principle is that you must not fool yourself―and you are the easiest person to fool.―Richard Feynman, "Cargo Cult Science"
I suppose that it would be too much to expect of a book titled The Science Delusion that it be well-argued, or that it should attempt to appeal to the reader's reason instead of emotion. Judging by Mark O'Connell's review in Slate of Curtis White's new book (which I linked to in Resource 2, below), it appears to be a diatribe attacking science and even reason itself. Now, I've been burned once before by a misleading review in Slate attacking a book for supposedly being full of fallacious and anti-science arguments (see Resource 1, below), but I haven't read this book yet so I can't judge for myself. So, keep in mind that what I say below is based on the review. O'Connell certainly makes it sound like the kind of book that would fit right on The Fallacy Files' Shelf of Shame between Hitler: Neither Vegetarian nor Animal Lover and The Secret:
[White']s anger can be rhetorically persuasive, particularly when he’s taking on sci-tech evangelists for ignoring the extent to which post-Enlightenment rationality has been responsible for at least as much human suffering as religion. “In spite of its obsession with Jews,” he writes, “the horror of Nazism was not a religious nightmare; it was a nightmare of administrative efficiency.”
We've seen this kind of argument before: Paul Johnson was falsely accused of using it in his short biography of Darwin, but there's no doubt that some religious conservatives who reject the theory of evolution have attempted to blame it for Nazism (see the second "Update" to Resource 1, below). However, White appears to be generalizing the blame to science as a whole or to reason itself and, from what I can tell from the review, he's no religious conservative―O'Connell says specifically that he's a "non-believer".
Where do White―or O'Connell for that matter, who seems to agree with White on this point―get the notion that Nazism, or even "administrative efficiency", was some kind of manifestation of "post-Enlightenment rationality"? Given that Nazism was, in fact, an irrational creed based on pseudoscientific racism and a conspiracy theory, it's almost by definition not a manifestation of post-Enlightenment or any other kind of rationality. "You keep using that word. I do not think it means what you think it means."
That said, even if one could make a case that science or rationality led to Nazism, it's a type of appeal to consequences to argue that therefore science or rationality are incorrect. The moral to draw from the example of Nazism is not that science or rationality are as bad as religion, but that fanaticism is a bad thing in any form.
While the Hitler Card seems to slip by O'Connell, he does catch a couple of other fallacies:
It isn’t that his targets aren’t richly deserving of his wrath; it’s that it’s so often channeled into puzzlingly irrelevant ad hominem attacks and hastily constructed straw men. White has it in for the theoretical physicist and Nobel laureate Richard Feynman…. [White] plunges us down the off-ramp and starts zipping along the low road at a ferocious clip: “I hope you will agree that this is a very disappointing conclusion for someone who was almost as famous for playing the bongos and going to strip clubs as he was for physics.” The next time Feynman appears, he’s introduced as “bongo man Feynman.” Maybe I’m missing something here, but it’s not apparent to me how a person’s enthusiasm for bongos and strip clubs has any bearing on whether his scientific ideas are worth taking seriously. This is about as clear a case as I’ve ever encountered of playing the man rather than the ball. And it’s frustrating not because you feel Feynman is being unfairly traduced but because this stuff is just not worth talking about in this context; it’s a pointless diversion, and it erodes your faith in White as a navigator of the territory. A more serious problem is a tendency to oversimplify and caricature the views he’s engaging with. …[T]he book is so filled with reductive imaginings of ideas that are already sufficiently weak in their actual form that the whole enterprise seems in danger of becoming a Million Straw Man March on the citadel of scientism.
Of course, you might think that if you're really anti-reason, then it makes sense to write a whole book consisting of nothing but fallacious arguments. However, if you think "rationality" is the problem, then why argue at all? Why not just bash anyone who disagrees with you over the head with a club? In fact, I think I'd rather be hit on the head with a club than have to read this book! (There's a blurb for you.) Though one good thing you can say for fallacious arguments is that they at least give lip service to arguing: as counterfeits of reasoning they confirm the value of real reasoning, just as counterfeit money depends on the value of genuine money. Accept no wooden nickels!
Source: Richard Feynman, "Cargo Cult Science" (1974). This is a good time to read, or reread, Feynman's classic lecture on what he called "cargo cult science". Feynman was no naive enthusiast for anything claimed to be "science", as White seems to think. White's book might well be classified as "cargo cult philosophy": it has the form of philosophy―arguments, for instance―but the planes don't land.
Resources:
- New Book: Darwin, 11/17/2012
- Blurb Watch: The Science Delusion, 6/16/2013
Fallacies:
Update (7/12/2013): Curtis White, author of The Science Delusion, has written a response to O'Connell's Slate review, also published in Slate (see the Source, below). Of course, White deserves a chance to respond, and it's good of Slate to give him a soapbox to reply to its review, but there's not much to it. But don't take my word for it, read it yourself―there's not much to it!
I still haven't read the book, and this short article doesn't make me any more inclined to do so than I was before; if anything, less so. White's main claim is that he was kidding with the straw man arguments and ad hominem attacks. It's good to hear that he wasn't serious, but it doesn't increase my interest in the book. What's worse, however, is that in the course of trying to defend himself against accusations he commits some additional howlers. For instance:
I confess I have been surprised by several of the reviews of my new book, The Science Delusion. I have been described as an angry…critic of straw men and perpetrator of ad hominem attacks. Putting aside the possibility that these characterizations are themselves ad hominem attacks….
This is a weaselly way of trying to accuse his critics of engaging in ad hominem attacks against him without committing himself to it. He says he's "putting aside" that "possibility", but by saying so he's actually raising the possibility in his readers' minds. If he really wanted to put the issue aside, he wouldn't have mentioned it; rather, he's trying to have his cake and eat it too. If he really thinks O'Connell's criticisms were ad hominem, he should have had the courage to say so instead of insinuating it. O'Connell at least had the honesty to come right out and accuse White of ad hominems.
More importantly, by raising this claim, White shows that he doesn't understand what an ad hominem is. If accusing a writer of ad hominems were itself one, then it would never be possible to accuse anyone of committing such a fallacy without committing the fallacy oneself. That, of course, is absurd, but even more absurd is the fact that White's own insinuation would be an ad hominem: his own argument self-destructs! Perhaps that's why he couldn't commit himself to it.
What’s a straw man? A straw man is the misrepresentation of an argument so that it is easier to attack. For example, when Richard Dawkins makes his case against religion by reducing the whole enterprise to evangelical Bible thumpers and the Taliban. … What’s an ad hominem attack? It is the lowest form of critique in which the human is attacked rather than the argument. For example, when Richard Dawkins calls Michel Foucault a “francophony.”
So, his defense is: "Richard Dawkins does it, too!" That's apparently supposed to make it alright; otherwise, why mention it? This is the tu quoque fallacy, which is a type of ad hominem (see the Fallacy, below, for an explanation―more accurately, it's tu quoque by proxy, see the Resource, below). So, White stands convicted of committing a type of ad hominem in the course of trying to defend himself against the accusation of committing ad hominems. Despite the fact that I haven't read White's book, I find O'Connell's criticisms more convincing now: sometimes the defendant shouldn't take the stand in his own defense.
Source: Curtis White, "Ode to a Straw Man", Slate, 7/12/2013
Resource: Q&A, 6/17/2010
Fallacy: Tu Quoque
June 16th, 2013 (Permalink)
Blurb Watch: The Science Delusion
For a change, let's look at a blurb for a book rather than a movie. I make this suggestion because an article in Slate (see the Source, below) just drew my attention to the new book The Science Delusion, by Curtis White―about which I'll have more to say later. To my surprise, the Kindle edition of the book has the following blurb on its "cover": "Splendidly cranky."―MOLLY IVINS. I was surprised because I seemed to recall that Ivins died some years ago. Are publishers now using mediums to get blurbs for their latest books?
In fact, Ivins died early in 2007. Has the book been in the works that long? It seems unlikely, as the copyright and publication dates on the Kindle edition are both this year. Instead, a web search reveals that Ivins is quoted on the author's earlier book, The Middle Mind: "A splendidly cranky academic." Presumably, this is a description of the book's author rather than the book, and the publisher just dropped the first and last words to make it sound as though Ivins was referring to the new book. Perhaps some people who are not aware of her death will purchase the book under the impression that she thought it "splendidly cranky", though I'm not so sure that crankiness is really a good quality for a book even if splendid.
This certainly opens up new possibilities for posthumous blurbing. Why stop with Ivins when there are so many other dead critics you could quote reviewing some other book than the one you need a blurb for?
Source: Mark O'Connell, "The Case Against Reason", Slate, 6/7/2013
June 12th, 2013 (Permalink)
Wedding Bill Blues
From a Slate article by Will Oremus:
Weddings are expensive. There’s no way around it. … Just how expensive are they? …[M]y fiancée and I did what most couples do: We asked Google how much the typical wedding costs. The answer from all quarters―wedding sites, credible news outlets, the New York Post―is remarkably consistent, precise, and definitive. It is also grossly misleading, and almost certainly wrong. “Average wedding cost $28,400 last year,” reports CNN Money. “Average U.S. wedding costs $27,000!!” enthuses the New York Daily News. “Average cost of U.S. wedding hits $27,021,” declares Reuters, which should know better.
Regular readers of The Fallacy Files should be able to figure out one big problem with these figures without reading the rest of the article. If it isn't obvious to you, however, stay tuned.
…[A] problem with the average wedding cost is right there in the phrase itself: the word “average.” You calculate an average, also known as a mean, by adding up all the figures in your sample and dividing by the number of respondents. So if you have 99 couples who spend $10,000 apiece, and just one ultra-wealthy couple splashes $1 million on a lavish Big Sur affair, your average wedding cost is almost $20,000―even though virtually everyone spent far less than that. What you want, if you’re trying to get an idea of what the typical couple spends, is not the average but the median. That’s the amount spent by the couple that’s right smack in the middle of all couples in terms of its spending. In the example above, the median is $10,000―a much better yardstick for any normal couple trying to figure out what they might need to spend. Apologies to those for whom this is basic knowledge, but the distinction apparently eludes not only the media but some of the people responsible for the surveys. I asked Rebecca Dolgin, editor in chief of TheKnot.com, via email why the Real Weddings Study publishes the average cost but never the median. …“If the average cost in a given area is, let’s say, $35,000, that’s just it―an average. Half of couples spend less than the average and half spend more.” No, no, no. Half of couples spend less than the median and half spend more.
Actually, the situation is a bit worse than Oremus suggests, since "average" is ambiguous, with both the mean and median as possible meanings, though the most common meaning is probably the former, as it is here. As long as you're dealing with a normal distribution―that is, it forms the famous "bell curve" when graphed―the mean and median will be very close together, so that it doesn't matter much which you use. However, statistics involving money, such as incomes or how much people spend on weddings, are seldom normally distributed. Instead of forming a bell curve, such distributions will usually look more like a childrens' playground slide: a steep ascent followed by a gradual falling off. A few very high incomes, or very expensive weddings, will pull the mean higher than the median. For such skewed statistics, the median will give a better idea of a typical member of the distribution than the mean.
Also, as Oremus discusses in the article―read the whole thing―the "average" wedding costs were taken from two surveys whose participants were not randomly selected, so it's possible that the samples were biased towards wealthy people who spend more on weddings than most people.
Source: Will Oremus, "The Wedding Industry’s Pricey Little Secret", Slate, 6/12/2013
Resources:
- "Average" Ambiguity, 11/4/2002
- How to Read a Poll
Fallacy: Biased Sample
June 10th, 2013 (Permalink)
Check it Out
- (6/12/2013) Another couple of Slate articles worth noting concern Robert F. Kennedy, Jr.'s vaccination conspiracy theories (see the Sources, below). According to Phil Plait:
RFK Jr. has a long history of adhering to crackpot ideas about vaccines, mostly in the form of the now thoroughly disproven link to autism. … I’ll note former Rep. Dan Burton (R-Ind.)…has long advocated anti-vax quackery, even participating in shameful hearings in Congress about it. It goes to show you that some anti-science knows no partisan bounds; it’s hard to imagine many other issues the conservative congressman and Kennedy would agree on. That’s an important point. A lot of anti-science tends to be a wholly owned subsidiary of the Republican Party: climate-change denial, evolution denial, stem-cell research, anything going against the more fundamental tenets of religion. Some of these are actually incorporated into the party’s planks. The Democrats are more diverse (and haven’t embraced their own flavors of anti-science in the party planks), but progressives do cleave to some anti-science, most broadly things like being against GMO foods and supporting “alternative” medicine. This is peculiar to me; I’d think a priori most progressives would be more likely to embrace science, but in these specific cases, at least, they’ve abandoned it. I find that disappointing. I think of myself as a progressive in many ways, though I take things on a case-by-case basis. By definition a progressive wants to move forward, to look to the future, rather than look back to a semi-mythical “good ol’ days.” That progress must include embracing science, the evidence behind it, and the methodology that leads to a more accurate understanding.
Sources:
- Laura Helmuth, "So Robert F. Kennedy Jr. Called Us to Complain…", Slate, 6/11/2013
- Phil Plait, "Robert F. Kennedy Jr.: Anti-Vaxxer", Slate, 6/5/2013
Resource: Check it Out, 2/18/2013
- Because of all the current forensic science television police shows, people seem to have an exaggerated idea of what can be done with DNA evidence. Fortunately, mathematician Jordan Ellenberg's latest Slate article helps explain why the reality is not as simple as what you see on TV:
It’s nice to imagine a world in which cracking a case means grabbing a fabric swatch from the crime scene, scanning it with the help of CheekSwab.gov, and then getting a report with the criminal’s name, address, photo, and last 10 tweets. But it’s not going to be that easy. Simple example: You get DNA from a hair found at the scene of the crime and find six usable places in the genome to test. The chance that any given person is a genetic match at those six places is pretty small, say 1 in 5 million. Now you run the sample through your database and you’re a happy detective because you find just one match. We got him! And when you try the case, the number “1 in 5 million” is going to be front and center. When the DA rips open his dress shirt at the culminating moment of his closing statement, “1 in 5 million” is what’s printed on the tank top underneath. That’s how I imagine it, anyway. But that number, impressive as it is, isn’t the right one.
To find out what the right number is, you'll just have to read the whole thing. Ellenberg is dealing here with the so-called "prosecutor's fallacy", though not under that misleading name. He also mentions the new book Math on Trial, which I pointed to a couple of months ago (see the Resource, below).
Source: Jordan Ellenberg, "Doubt and the Double Helix", Slate, 6/5/2013
Resources:
- The Prosecutor's Fallacy, 10/30/2006
- New Book: Math on Trial, 4/3/2013
June 3rd, 2013 (Permalink)
Charts & Graphs: The 3D Bar Chart, Part 1
Get out your red-and-blue tinted glasses, it's time for the next installment of our series on how to mislead people with graphs. Last time, we looked at how pie charts in which the "pie" has a three-dimensional appearance, instead of being a simple circle, can give a false impression of the relative sizes of its "slices". Something similar can happen when an extra dimension is added to a bar chart, though you won't actually need any special glasses to see such a graph because, as with the pie type, perspective is added to the chart to create the 3D effect. Usually, the extra dimension adds no additional information―it's just there to make the chart more visually appealing―but the added dimension can sometimes distort the information contained in the chart. Of course, this may be the result of careless or ignorant chartmaking, but sometimes it may be intentional distortion.
There are two ways that this kind of chart may be misleading; in this installment we'll look at the first, and the second type will be the subject of our next entry in the series. In some 3D bar charts, the perspective is such that you seem to look down upon the bars from above so that you can see their tops. More technically, the vanishing point or points on the horizon in the graph are above the tops of the bars.
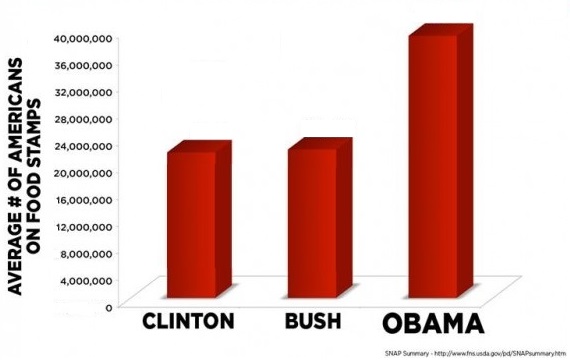
For an example, see the chart above and to the right. This is a revision of a misleading chart that lacked a zero baseline (see see Source 1 & Previous Entry 2, below), which was a more misleading fault, but the revision retains the overhead perspective of the original. If you try to gauge the number of food stamp recipients under Obama from the chart using the naked eye, it will probably appear to be in excess of 40 million, the top number in scale. The actual number from the original chart is slighly less that 40 million, but the fact that the back of the bar extends above the 40 million mark makes it difficult to visually judge the height of the bar. So, at best, a 3D bar graph with an overhead perspective makes it difficult to accurately judge the heights of its bars; at worst, it can lead to an exaggerated notion of the size of some of the bars, which seems to have been the intention of the original version of this chart.
As is true of all the types of charts and graphs in this series, there's no hard-and-fast rule against using perspective in bar charts to make them more attractive. Rather, both as maker and as consumer of bar charts, you should keep in mind the potential for distortion that is introduced into a chart by adding a third dimension, and make allowances to avoid that―unless, of course, your goal is to mislead people, which I don't recommend.
Sources:
- Charts and Graphs, 6/4/2012
- Gerald E. Jones, How to Lie with Charts (2000), pp. 78-80
Previous Entries in this Series:
- The Gee-Whiz Line Graph, 3/21/2013
- The Gee-Whiz Bar Graph, 4/4/2013
- Three-Dimensional Pie, 5/5/2013
Next Entry in this Series: The 3D Bar Chart, Part 2