Previous Month | RSS/XML | Current | Next Month
WEBLOG
February 17th, 2024 (Permalink)
200B or not 200B?
Earlier this month, The Irish Sun published an article on plastic water bottles which included the following claim in its headline:
Adults will drink from 200 billion single use plastic water bottles in a lifetime1
The first sentence of the article beneath the headline makes the same claim with a slightly different wording: "Adults will get through more than 200 billion single use plastic water bottles in a lifetime…." That sounds like a lot! Sadly, the remainder of the article says nothing further about this claim, instead making various other claims about plastic particles in the water and their possible health and environmental effects. This entry will address only the headline claim2.
There is one possible source of confusion in the headline that needs to be cleared up before we continue, namely, what is a billion3? A "billion" in British English used to mean a million million, whereas it is a thousand million in American English. So, in old sources one would need to ascertain whether the British or the American "billion" was meant. The article itself does not explain its usage, but the American "billion" is now standard, so I'll assume that "200 billion" means "200 thousand million", or 200,000,000,000. Again, that looks like a lot, but 200 of the old-fashioned British billions would be a thousand times more!
The headline claim is a good candidate for a credibility check4: Is it plausible that an adult uses 200 billion plastic bottles in a lifetime? How would you go about checking it for credibility? Try doing it yourself, then click on "Credibility Check", below, to see what I came up with.
Try dividing and conquering; if you don't know how to do so or need a refresher, see: Divide & Conquer, 2/4/2022.
The headline appears to say that an adult uses 200 billion plastic water bottles over the course of a lifetime; that's: 200,000,000,000 bottles. One way to check this claim is to divide and conquer. I don't have a good sense of how many plastic bottles I will use over my life, though the claim sounds incredible to me. However, I have a better sense of how many I use in a day, so let's divide 200 billion by the number of days in an average lifespan.
How long do people live on average? This depends on where you live and other factors, but the current average American lifespan is around eighty years, so let's go with that. How many days are there in such a lifespan? We simply multiply eighty by the number of days in a year, which gives us 29,200. So, if you're an American, you can expect to live close to 30,000 days―that seems alarmingly few!
Now, to see how many plastic bottles we supposedly use in a day, we simply divide 200 billion by 30 thousand, to get about 6.7 million bottles a day! Obviously, this is absurd.
If you have a good number sense, you may have realized that the headline claim was absurd even without doing a credibility check, but the check is still useful. As I mentioned, nothing in the article itself explains where the claim came from or what was supposed to justify it. However, a similar article was published the same day with the headline:
Over 200 billion single-use plastic water bottles are bought nationwide in a lifetime5
Apparently it's not an individual adult buying those 200B plastic bottles, but an entire nation. Which nation, though? This article is from a newspaper based in the United Kingdom (UK), so presumably the nation in question is the UK. The article itself is otherwise similar to The Sun's, and both would appear to be based on a press release put out by Ocean Bottle, a company that is promoting its reusable water bottles6. In effect, both articles are ads for the company's bottles.
While this headline makes more sense than the first, what does it mean to say that 200B bottles are bought "in a lifetime" when we're not talking about an individual person? Except metaphorically, nations do not have "lifetimes", and the UK is still "alive" and we've no idea how much longer it may "live", so how could we know how many bottles will be bought in its "lifetime"?
Yet another newspaper article sheds enough additional light on this mystery that we may be able to solve it; here's its headline:
Average adult will buy almost 4,000 single-use plastic water bottles in their lifetime7
In comparison to the previous headlines, this is a plausible claim, amounting to fifty bottles a year over the course of an eighty-year lifetime, so about one bottle a week. However, beneath the headline, the article reads: "This amounts to over 200 billion plastic water bottles bought nationwide…". So, this is where the 200B bottles claim comes from, but there is still some mystery as to how we get from the headline of 4K bottles in an average adult's life to 200B for the entire UK. Is it 200B over a span of eighty years? If so, then it's only two-and-a-half billion a year, which doesn't sound so bad, but perhaps that's just in contrast to 200B: it's "only" 2.5B.
Here's a possible solution to the mystery: If we assume that those eighteen and over are adults, then about three-quarters of the population are adults8. The population of the UK is approximately 68 million9, so 3/4ths is 51M. 51M times 4K is just a bit over 200B, so this may be the source of the headline number. If so, 200B is an estimate of how many plastic bottles will be used by the current population of adults in the UK over a period of eighty years.
What a strange statistic! Why was this bizarre statistical claim created? The obvious reason, and the only one that I can think of, is to inflate the number in order to get an extremely large one for the headlines. The 200B statistic seems to have originated with Ocean Bottle, and the tabloid newspapers of the UK simply repeated it, apparently without even understanding it.
Notes:
- Dan Coles, "Plastic Bits: Adults will drink from 200 billion single use plastic water bottles in a lifetime–even though it’s bad for their health", The Irish Sun, 2/5/2024.
- I am skeptical of many of the claims made in the body of the article, and perhaps will address one or more of them in a future entry.
- "Billion", Cambridge Dictionary, accessed: 2/16/2024.
- For advice on how to check credibility, see the following series:
- Compare & Contrast, 1/7/2022
- Divide & Conquer, 2/4/2022
- Ratios, Rates & Percentages, 3/27/2022
- Ballpark Estimation, 4/21/2022
- Martin Winter, "Over 200 billion single-use plastic water bottles are bought nationwide in a lifetime", Express, 2/5/2024.
- I haven't been able to find an actual press release, but the articles are so similar that it seems likely they were based on the same source. The following webpage contains many of the claims from the newspaper articles, including the 200B bottles claim: "Break Up with Bottled Water", Ocean Bottle, accessed: 2/17/2024.
- Martin Winter, "Average adult will buy almost 4,000 single-use plastic water bottles in their lifetime", Mirror, 2/5/2024. This is mostly the same article as that under note 5, above, but with a different headline.
- 63 years out of 80 is almost 79%, but there are fewer people of advanced age.
- "What is the population of the United Kingdom?", Wolfram Alpha, accessed: 2/16/2024.
February 12th, 2024 (Permalink)
Apples Vs. Oranges
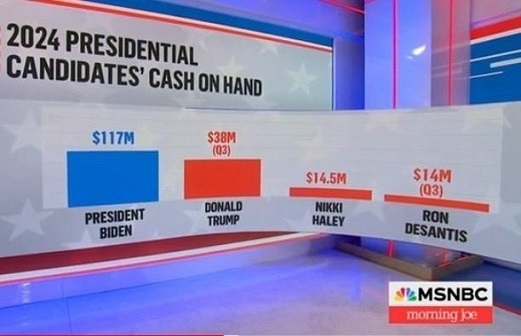
In the previous entry, we looked at a confusing bar chart presented recently on an MSNBC program1. The emphasis in that entry was on the chart itself, and not the underlying data, which we take up now. The data itself was quite simple: it purported to be the amount of cash that each of four candidates for president had on hand. Here it is in tabular form―we'll talk about the "Q3"s later:
| Candidate | Cash on Hand |
|---|---|
| President Biden | $117M |
| Donald Trump | $38M (Q3) |
| Nikki Haley | $14.5M |
| Ron DeSantis | $14M (Q3) |
It would have been far better if MSNBC had presented this information in a table such as this than in the misleading bar chart it used. Nonetheless, is this data correct? Is it really the case that Biden has over three times as much "cash on hand" as Trump? Where did these numbers come from?
Though the chart itself provides no information on the source of its data, the number for Biden appears to come from a press release put out by his campaign; here's how The Hill reports it:
The Biden-Harris reelection campaign announced on Monday it has $117 million on hand, in what aides claim is the largest sum for any Democratic candidate in history at this point in the race. … The total includes fundraising efforts by the campaign, joint fundraising committees and the Democratic National Committee.2
The same report goes on to state: "Republican candidate Nikki Haley announced her fourth quarter fundraising numbers this month, saying she raised $24 million, ending the quarter with $14.5 million on hand." So, this explains a puzzling aspect of the MSNBC chart, namely, why there was a "Q3" in parentheses after both Trump and DeSantis' data, but not after either Biden or Haley: the latter two candidate's numbers were based on end of the year―that is, fourth quarter―reports, whereas the former only on third quarter reports.
This fact already indicates that the chart compares apples to oranges, that is, the fourth quarter numbers of Biden and Haley to the third quarter ones of Trump and DeSantis. These were presumably the most recent numbers available, but the candidates' finances may have changed considerably in three months.
Not only does the chart compare the current numbers for Biden to outdated ones for Trump, but that for Biden includes cash from "joint fundraising committees and the Democratic National Committee [DNC]", whereas the number for Trump is only for Trump's campaign itself, and does not include money raised by the Republican National Committee (RNC)3.
What is the justification for this disparity? No doubt Biden is the presumptive nominee for the Democrats, but Trump is also the probable nominee of the Republicans, though neither candidate is the actual nominee yet. Trump may yet fail to be nominated, perhaps because of his legal problems, but the same thing could happen to Biden given his own legal and age-related difficulties. In any case, I can't see any good reason for including the DNC's money as if it belongs to Biden's campaign but treating the RNC's as separate from Trump's.
As a result, the data compares apples and oranges in both the reporting periods―that is, Q3 versus Q4―and in what is counted as "cash on hand". The end result creates the appearance that Biden has a much greater amount of money than Trump.
How much money do the Biden and Trump campaigns have at this point? According to The New York Times4, at the end of last year, Biden had $46M cash on hand while Trump had $33M. So, Biden is ahead of Trump but "not overwhelmingly", as The Times' headline puts it.
In the previous entry, I claimed that there didn't appear to be political bias underlying the chart itself, which was just too confused to benefit any particular candidate. However, the data underlying the chart does appear to be politically biased in favor of the Biden campaign, giving the false impression that Biden is way ahead of Trump in terms of money. This could reassure worried Democrats that the campaign can spend its way out of problems such as Biden's low approval rating5 and losing position in recent public opinion polls6.
It's reporting such as this that makes MSNBC simply appear to be a propaganda outlet for the Democratic party in general and the Biden campaign in particular.
Notes:
- Charts & Graphs: MSNBC Tries to Outfox Fox, 2/8/2024.
- Sarah Fortinsky, "Biden-Harris campaign says it has largest war chest of any Democratic candidate in history", The Hill, 1/15/2024.
- Jessica Piper, "Trump campaign reports having $37M in the bank heading into the primaries", Politico, 10/5/2023.
- Reid J. Epstein, "Biden Is Beating Trump in Money Wars, Though Not Overwhelmingly", The New York Times, 2/1/2024.
- Jeffrey M. Jones, "Biden's Third-Year Job Approval Average of 39.8% Second Worst", Gallup, 1/25/2024.
- "2024 General Election: Trump vs. Biden", Real Clear Polling, accessed: 2/12/2024.
February 8th, 2024 (Permalink)
Charts & Graphs: MSNBC Tries to Outfox Fox
Fox News used to be an object of ridicule for its meaningless charts1, but MSNBC may now be outdoing Fox; the chart shown above appeared on the "Morning Joe" program on January 15th of this year2.
The purpose of a bar chart is to encode data in the heights of the bars so that people can visually compare the bar heights to get a sense of the relative sizes of the data represented. In this chart, however, there's no relationship between the heights of the bars and the data given in numbers above them. For instance, the bar supposedly representing Trump's "cash on hand" is about 70% of the height of that for Biden, yet the numbers above the bars indicate that Trump has only about a third as much cash.
Similarly, according to the numbers, Haley and DeSantis have almost the same amount of cash, yet DeSantis' bar is about two-thirds the height of that for Haley. None of the height comparisons between bars are consistent with the numerical data supplied in the chart. For instance, Haley has about two-fifths as much cash as Trump but her bar is about one-fifth the height of his.
So, there is an inconsistency between the data and the chart that is at best confusing, and at worst misleading. A casual viewer who only looks at the bars, ignoring the numbers above them, will get a false impression of the data. In contrast, a viewer who pays attention to both bars and the numbers above them will just be confused. Which should we believe: the bars or the numbers3?
What could account for this bizarre bar chart? MSNBC is well-known as left-leaning and biased in favor of the Democratic party4, but political bias doesn't seem to explain this chart. Did whoever used to do Fox's charts move over to MSNBC?
Notes:
- For instance: Walt Hickey, "Exposed: Here Are The Tricks That Fox News Uses To Manipulate Statistics On Its Graphics", Business Insider, 11/28/2012.
- Here is the episode: "Morning Joe, MSNBC, January 15, 2024, 3:00am-7:00am PST", Internet Archive. The chart appears at about the 5:59 mark. I found the chart here: Kaiser Fung, "The art of making simple things harder", Junk Charts, 2/2/2024.
- I expect to examine the actual data displayed in the numbers on the bars in this chart and post a follow-up report over the weekend.
- "MSNBC―Bias and Credibility", Media Bias/Fact Check, 6/27/2023.

February 5th, 2024 (Permalink)
Taylor Swift for President!
A recent headline from "Newsweak" magazine reads:
Can Taylor Swift Sway Voting in the 2024 Election?1
What prompted this headline was a new poll, as we read beneath it:
Taylor Swift is arguably the most famous person in America, and while she's largely avoided politics, her stratospheric fame raises questions about whether an endorsement from the pop star could help decide the next president. Exclusive polling conducted for Newsweek…found that 18 percent of voters say they're "more likely" or "significantly more likely" to vote for a candidate endorsed by Swift.2
However, the very next sentence of the article reads: "Seventeen percent said they would be less likely to vote for a Swift-backed candidate, while 55 percent would be neither more nor less likely to do so.1" So, those voters less likely to vote for a Swift-endorsed candidate were only one less percentage point than those more likely to vote for that candidate, and when you take the margin of error (MoE) of two-and-a-half percentage points into account, even that small difference disappears. This ought to win the Emily Litella "Never Mind" Award for Journalism.
The article mentions the fact that Newsweek's competitor, Time magazine, named Swift the Person of the Year last year3, as somehow accounting for her alleged ability to sway the election. To put this into perspective, it's also the same magazine that just laid off 15% of its editorial staff4. I suspect that choosing Swift for this "honor" and putting her on the cover was a desperate attempt to sell magazines, but it doesn't seem to have worked well enough.
The answer to the headline question, in accordance with Betteridge's Law5, is "no": whatever voters are swayed favorably by a Swift endorsement are cancelled out by those swayed unfavorably. This is heartening news for democracy, though it's still worrying that 35% of voters would be swayed in any direction by a pop star's endorsement.
Notes:
- Katherine Fung, "Can Taylor Swift Sway the 2024 Election?", Newsweek, 1/31/2024.
- Ibid., paragraphing suppressed.
- Sam Lansky, "2023 Person of the Year: Taylor Swift", Time, 12/6/2023. Not recommended reading: a long, tedious puff piece that might be useful as an emetic. The article compares Swift to Elvis Presley, Bob Dylan, William Wordsworth and Christ the Redeemer―I'm not making this up. Also, her concerts are religious experiences, and she single-handedly saved the economy. It's hard to overstate the overstatements. The pictures are pretty, though.
- Liam Reilly, "TIME Magazine lays off 15% of unionized editorial staff, becoming latest news outlet to slash workforce", CNN, 1/23/2024.
- Betteridge's Law is: "When a headline asks a question, the answer should be 'no'"; see: Jack Murtha, "Can you really tell an entire story in a headline?", Columbia Journalism Review, 9/8/2015.

February 3rd, 2024 (Permalink)
The Return of the Troublesome Triplets
Detective David Davidson heaved a sigh when he saw that the suspects in a robbery were the Taylor brothers: Abner, Benji, and Carlo. Though they were identical triplets and couldn't be distinguished by sight, they had extremely different personalities. Abner had studied Kantian philosophy in college and took it so seriously that he wouldn't lie about anything, Benji was so pathological a liar that he never told the truth, but Carlo was just a normal guy who lied sometimes and told the truth on other occasions.
One of the three brothers had robbed a bank and walked out with a lot of money, but which brother? Because the three could not be told apart by sight and because what they said could not be trusted, Davidson was not sure which was which. Carlo had just gotten out of jail for a similar theft*, so he was the obvious suspect. Davidson had the three brothers brought in for questioning.
One of the three―Davidson didn't know which―refused to say anything, but each of the other two made a single statement then invoked his right to silence. Here are the two statements:
First Brother: "Either my brother is lying or Carlo stole the money."
Second Brother: "Either my brother is telling the truth or Carlo stole the money."
Who stole the money?
Extra Credit: What are the names of the first and second brother? What is the name of the brother who refused to say anything?
There are four possibilities: both brothers lied, both told the truth, the first told the truth but the second lied, or the second told the truth and the first lied.
Disjunctive statements―that is, either-or statements such as both brothers made―are only false when both disjuncts―the statements before and after the "or"―are false, and true if even one is true.
Carlo stole the money.
Explanation: Suppose that the first brother was lying; then it must be case that the second brother was telling the truth and Carlo did not steal the money. However, if the second brother was telling the truth, then Carlo must have stolen the money, since the first brother was not telling the truth. But Carlo cannot have both stolen and not stolen the money, so the first brother must have been telling the truth.
Suppose that the second brother was lying; then the first brother was not telling the truth and Carlo did not steal the money. However, we already know that the first brother told the truth. Therefore, so did the second brother.
Given that both brothers told the truth, Carlo must have stolen the money, since otherwise the first brother would not have told the truth.
Extra Credit Solution: The two brothers who were questioned were Abner and Carlo, since both told the truth, though we can't tell which was which. The one who refused to answer was Benji.
*See: The Troublesome Triplets, 1/29/2023
Disclaimer: The puzzle you have just read is fiction. The names have been changed to protect the innocent.

February 1st, 2024 (Permalink)
Soviet Anti-Semitic Propaganda & the Death of the Debates
- Izabella Tabarovsky, "The Language of Soviet Propaganda", Quillette, 1/11/2024. Warning: Contains an unexpurgated epithet.
…[T]oday’s progressives are speaking the language of Soviet propaganda. The most extraordinary feature of the anti-Israel rhetoric flooding the West today is the extent to which it reproduces the motifs, tropes, slogans, and explanatory logic of late-Soviet communist ideology. … Today’s far-Left is driven by a mongrel ideology that cross-pollinates Marxism, intersectionality, postcolonialism, and critical theory, and that draws upon a battle-tested set of rhetorical tools built and honed by Soviet masters of ideological subversion during the last 25 years of the Cold War. …
Soviet propaganda painted Zionism as a racist, fascist, Nazi, settler-colonial, imperialist ideology that opposed everything that socialism and communism stood for. The fact that Jewish socialists had played a crucial part in founding Israel, and that its establishment received the USSR’s stamp of approval at the UN in 1947, was now erased from memory. In the Soviet portrayal, Israel was now Nazi Germany and apartheid South Africa at once; a tool of American imperialism and the shadowy force steering the West to do the Zionists’ bidding. Following the traditionally paranoid Soviet political style, and borrowing a page from antisemitic conspiracy theory, Soviet propagandists presented Zionists as being everywhere and running everything at once. It wasn’t a coincidence that Soviet caricatures of Zionism—hook-nosed spiders and octopuses holding the world in their tentacles—were carbon copies of Hitlerian propaganda.
Although the Soviets claimed that anti-Zionism was not the same as antisemitism (a claim that today’s progressives have also adopted), the version of anti-Zionism they sold to the world was drawn from concepts popularized by an infamous antisemitic fabrication titled The Protocols of the Elders of Zion. In Soviet telling, Zionists were a treacherous fifth column in every country. They were greedy and immoral. Where the Protocols talked about “international Jewry” owning the press, banks, and politicians, the Soviets talked about Zionists doing the same. Where the Protocols said that Jews wanted to manipulate the world, Soviet propaganda said the same of Zionists.
Between 1967 and 1991, the USSR produced hundreds of books and tens of thousands of articles vilifying Israel and Zionism in this conspiracist style. It translated them into dozens of languages, making them available in every country Soviet propaganda could reach (in the Soviets’ own estimate, some 100 countries). They used Soviet embassies, international conferences, scholarly events, front organizations, and connections with leftist groups to spread the same message. During the 1970s and ’80s, countless Western leftist publications used Soviet conspiracist anti-Israel language in their writings. …
This Soviet propaganda heritage is part of the reason it is becoming increasingly difficult on social media to distinguish between progressive, neo-Nazi, and Islamist rhetoric about Jews. Progressives pack their language with vicious anti-Jewish tropes, thinking it’s enough to replace Jew with Zionist. Far-Right Holocaust deniers boost progressives denying Hamas atrocities. The red-green alliance is now a tricolor of red, green, and brown.
This is not the first time that communists and fascists have been allies: the Soviet Union and Nazi Germany were allied at the beginning of WW21.
For the Soviets, this was precisely the idea. Their anti-Israel campaign was largely driven by a cold calculation of political interests, but they also understood the power of the “Jewish Question.” They knew how to manipulate it to unite illiberal constituencies across the Western and developing worlds, while building sympathy for their cause and creating cracks in Western public opinion. …
It is deeply disturbing that intelligent American progressives are such easy and gullible targets for totalitarian propaganda past and present. Their expensive Ivy League educations have failed to prepare them with basic historical knowledge and critical thinking. This is particularly troubling since propaganda—particularly the sophisticated kind the Soviets developed with state resources—is hard to combat head-on.
The only real approach we have is to educate. We need to teach the next generation how to think. We need to teach them the history of the Soviet Union and its track record of propaganda and ideological subversion. We need to supplement Holocaust education with education about anti-Zionist antisemitism and how to protect our societies from this scourge. We need to teach young people that there is a difference between demonization and criticism, and that there are plenty of ways to criticize Israel without sounding like Russian pre-revolutionary pogromists and Nazis. This path is long. The shortcuts are few. The time to start is now.
- Jennifer Tiedemann, "2024 killed the presidential debate. Here’s why it should still matter.", The Hill, 1/26/2024
…2024 has destroyed the argument that presidential debates matter, and perhaps it’s even the final nail in the coffin for this political custom. If we’re indeed hearing the debate death knell, the ramifications for political discourse could be huge—and very unfortunate.
Isn't this a bit premature? We're barely into 2024.
Former President Trump’s landslide victory in the Iowa caucuses wasn’t unexpected, but it was notable for the fact that Trump never set foot on a debate stage to make his case—and yet he cruised to a 30-point victory. More states appear poised to hand Trump at least a plurality of delegates to seal his nomination. Trump and his team predicted that debating the likes of Florida Gov. Ron DeSantis…and Nikki Haley would be unnecessary to become the GOP nominee, and it appears that the strategy will pay off.
It goes unmentioned here that the Democratic party didn't even schedule any debates between President Biden and challengers such as RFK, Jr. and Marianne Williamson2.
While eschewing debates might have seemed like a gamble in past election cycles, it may not be such a gamble this year. Trump’s disdain for debating has been mollified by the Republican National Committee, which announced in December that it would no longer sponsor primary debates.
Yes, but the most recent debate was sponsored by CNN3. Also, look up "mollified"4: people are mollified, so the RNC could mollify Trump but not his disdain.
Assuming the general election matchup is Trump-vs.-Biden, Trump’s reluctance, coupled with the Biden campaign’s fear that the sitting president will make some gaffe that plays into growing concerns about his advanced age, make it quite possible that neither candidate will agree to square off in even one debate.
Trump has already announced his willingness to debate Biden even if the debates are sponsored by the CPD5. It's possible, of course, that he could still find some excuse to back out. However, Biden, has not yet publicly agreed to debate6.
But while debates might end up not mattering in 2024, should they matter? Presidential debates have long served an important role in the political process. They introduce candidates to the public. They allow voters to size up candidates and compare ideas, issue stances, personalities and temperaments with the goal of helping them make informed decisions at the ballot box. …
Generally speaking, I agree that these are useful roles for presidential debates, but it appears that this year will be an exception: both of the main candidates have already served, so there's no need to introduce them to voters. In addition, most people already know a great deal about both candidates' "ideas, issue stances, personalities and temperaments", and have probably made up their minds about them. Any adult of voting age who is unfamiliar with the candidates is probably a non-voter, with the only possible exception being youngsters voting this year for the first time.
However, these days, there are so many ways in which candidates share themselves with voters that simply didn’t exist even a few years ago. Options include direct outreach via social media, Reddit Ask Me Anything forums and online town hall meetings. Furthermore, as political polarization grows, fewer undecided voters can be swayed by strong debate performances.
Good point, but it undermines your argument!
But presidential debates serve a function that these newer forms of communication simply don’t: They force candidates to talk to one another. Campaigning is becoming just as atomized as political media—it’s increasingly possible for voters to interact only with the candidates they like and avoid the others. Debates preserve at least a semblance of the notion that conversation among candidates matters, that the warp and weft of any campaign is ultimately about ideas and discourse.
Even if presidential debates survive the current era, it seems likely that we’ll see more candidates choose to opt out. Those who don’t respond well to unchoreographed situations might think that participation will only increase the likelihood of making a mistake that will sink their political prospects. Rather, they might stick to highly choreographed events in which they’re likely to go unchallenged.
The modern tools and techniques that have already emerged to aid campaigning have made it easier to take this path. As new tools continue to emerge—ones that emphasize connection with political supporters and influencers over discourse and debate—it will likely become even easier to do so going forward.
Political debates have changed a lot since the Lincoln-Douglas days, but they’ve always adapted to changing times—from the rise of television to the need for shorter soundbites. However, with Trump’s seemingly unobstructed path to the GOP nomination and the Biden campaign’s fear of unscripted events, the clock may have simply run out.
Perhaps, but that's just this year, and this year is weird: the last time the same two presidential candidates faced each other in consecutive elections was in the 1950s7, which was before the era of presidential debates had begun.
While Trump and Biden could deal a big blow to debates, they don’t deserve all the blame: Presidential campaigning is evolving into more of an echo chamber than ever before, with candidates talking less to each other and more into the ether.
It’s up to us voters to hold the political class accountable and demand the chance to see how candidates handle high-pressure situations and engage with one another. We are the ones who lose the most when the state of political discourse deteriorates.
It's too early to declare the death of presidential debating, since there may well be one or more debates this year. There have been rumors in past election years, including both 20168 and 20209, that one of the two main candidates might refuse to debate. Moreover, even if the debates don't occur this year, that doesn't mean they won't be back four years from now.
Finally, the nation managed to muddle through without presidential debates for 184 years10. So, even if debating goes away starting this year, we may be able to muddle through for another 184 years without them.
Notes:
- Editors, "German-Soviet Nonaggression Pact", Encyclopaedia Britannica, 1/23/2024.
- James Bickerton, "Fact Check: Do Democrats Plan to 'Cancel' Presidential Primary Debates?", Newsweek, 4/25/2023. A silly "fact check": the Democrats didn't need to cancel any debates since they never scheduled any. As they often do, the fact-checker chose to check some ignorant Nitwitter that I've never heard of, and it's obvious that he was just making fun of the Democrats.
- Mabinty Quarshie, "Republican debate: Top four takeaways from one-on-one clash between Haley and DeSantis", Washington Examiner, 1/11/2024.
- "Mollified", Cambridge Dictionary, accessed: 1/29/2024.
- "Former President Donald Trump On President Biden, Support for Israel, The War In Ukraine, Campaign 2024, and What a Second Trump Term Would Look Like", Hugh Hewitt, 12/22/2023.
- Philip Elliott, "The Last Presidential Debate of 2024 May Have Already Happened", Time, 1/31/2024.
- Drew DeSilver, "A Biden-Trump faceoff in 2024 wouldn’t be the first presidential rematch", Pew Research, 5/16/2023.
- Debate Preparation, 9/25/2016.
- The Debate About the Debates, 8/31/2020.
- The first televised debate, at any rate, took place in 1960 between incumbent Vice President Richard M. Nixon and Senator John F. Kennedy; see: "A Biden-Trump faceoff in 2024 wouldn’t be the first presidential rematch", Pew Research, 5/16/2023.
Disclaimer: I don't necessarily agree with everything in these articles, but I think they're worth reading as a whole. In abridging them, I have sometimes changed the paragraphing and rearranged the order of the excerpts in order to emphasize points.
