Previous Month | RSS/XML | Current | Next Month
WEBLOG
October 31st, 2022 (Permalink)
A Halloween Costume Party
Five friends had a great idea for the Halloween costume party: they would dress up as each other, that is, each friend would dress up as one of the others, and no two would portray the same friend. So, they wrote their names on five slips of paper, which were then shook up in an old pillowcase, and each friend took a turn drawing out a name. Of course, if any friend drew his or her own name, another slip was drawn so that someone else was selected. From the following clues, can you determine whose name each one drew?
- No pair of the friends drew each other's names.
- Beth, who is Alan's sister, laughed when she saw that the slip of paper she drew had her boyfriend's name on it.
- To Eric's great relief, his name was not drawn by one of the girls, which included Deb.
- Clark sighed when he pulled a slip of paper out of the pillowcase with a girl's name on it.
Beth drew either Clark's or Eric's name, since she didn't draw Alan's or Deb's, by Clue 2. Eric's name was drawn by either Alan or Clark, by Clue 3. Therefore, Beth must have drawn Clark's name. Clark did not draw Eric's name, by Clue 4, so Alan drew it. By Clue 1, Eric did not draw Alan's name and Clark did not draw Beth's. Therefore, Clark must have drawn Deb's name, by Clue 4. By a process of elimination, Deb must have drawn Alan's name and Eric drew Beth's.
To sum up: Alan drew Eric's name, Beth drew Clark's, Clark drew Deb's, Deb drew Alan's, and Eric drew Beth's name.
WARNING: Do not try at home.

October 29th, 2022 (Permalink)
The Cowardice of the Press & "Mother Jones on Steroids"
- Erik Wemple, "James Bennet was right", The Washington Post, 10/27/2022
Controversy over an op-ed by Sen. Tom Cotton (R-Ark.)1 consumed the New York Times [NYT] in June 2020 and claimed the job of then-editorial page editor James Bennet. Two-and-a-half years later, Bennet has shared some thoughts about the episode�and, in particular, the role of Times Publisher A.G. Sulzberger. �He set me on fire and threw me in the garbage and used my reverence for the institution against me,� Bennet recently told Ben Smith of Semafor. … That might sound like the angst of a guy who�s still disgruntled at losing his job. And it is, for a compelling reason: Bennet is right. He�s right about Sulzberger, he�s right about the Cotton op-ed, and he�s right about the lessons that linger from his tumultuous final days at the Times. … To date, the lesson from the set-to�that publishing a senator arguing that federal troops could be deployed against rioters is unacceptable�will forever circumscribe what issues opinion sections are allowed to address. It�s also long past time to ask why more people who claim to uphold journalism and free expression�including, um, the Erik Wemple Blog�didn�t speak out then in Bennet�s defense. It�s because we were afraid to. …
Notice that Wemple did not work for the NYT, he worked for The Washington Post, yet it took him until now to work up the courage to defend Bennet.
Cotton�s office, which had previously published two op-eds in the Times…got to work. It delivered a 950-word essay exploring invocation of the Insurrection Act against rioters who destroyed property, and worse, amid the otherwise peaceful protests over the murder of George Floyd.
We've heard this one before: except for the violence, arson, and looting, the protests were peaceful.
… A backlash swiftly combusted, with Times staffers at the forefront of the critique. Nikole Hannah-Jones, creator of the Pulitzer Prize-winning 1619 Project, tweeted that the paper should have done a news story to push back against Cotton�s ideas, as opposed to �simply giv[ing] over our platform to spew dangerous rhetoric.� …
The NYT should have worried more about giving a platform to a pseudo-historian.
Many Times staffers, however, forwent the rigor of argumentation and tweeted out the following line�or something similar�to express their disgust: �Running this puts Black @NYTimes staff in danger.� … The �danger� tweets�along with a letter from Times employees slamming the op-ed�landed with impact. Although Sulzberger initially defended publication as furthering the �principle of openness to a range of opinions,� he bailed on that posture within hours. By the afternoon after publication, the paper had determined that the piece failed to �meet our standards,� according to a statement.
"It failed to meet our standards" actually meant "we lack the courage to defend our standards".
As Sulzberger flip-flopped, an astonishing up-is-down moment unfolded at the paper�s upper reaches. Whereas media outlets typically develop arguments to defend work that comes under attack, the opposite scenario played out over the Cotton op-ed: Top Times officials, according to three sources, scrambled to pulverize the essay in order to vindicate objections rolling in from Twitter. A post-publication fact-check was commissioned to comb through the op-ed for errors, according to the sources, even though it had undergone fact-checking before publication. The paper�s standards desk spearheaded work on an editor�s note. …
The review didn�t deliver the factual bloodbath alleged by critics. The fact-check flagged a misquotation that should have been rendered as a paraphrase. It also examined objections to Cotton�s claim that �cadres of left-wing radicals like antifa� were �infiltrating protest marches to exploit Floyd�s death for their own anarchic purposes.� That topic was the focus of various conflicting official statements and news stories�some of them published by the Times�in the run-up to the Cotton op-ed and extending well beyond it. The editor�s note asserted that the claims about antifa �have not been substantiated and have been widely questioned. Editors should have sought further corroboration of those assertions, or removed them from the piece.�
So, who was smashing windows, looting stores, and setting cars and buildings on fire? Were the "editors" behind this note contending that it was the "mostly peaceful" protesters who did so? Or did the buildings spontaneously combust?
Such was the spirit of the editor�s note, which went heavy on regrets about tone, process and other squishy considerations. While asserting that the op-ed failed Times standards, it also claimed that the essay�s arguments were a �newsworthy part of the current debate�…. Elsewhere, it said the op-ed should have undergone greater scrutiny, even though at least five opinion editors participated in editing, according to sources. … Although Bennet said he hadn�t read the piece, he was involved in some early decisions about it, including the deletion of a criticism of Hannah-Jones. Other critiques from the editor�s note included that the essay needed �further substantial revisions�; that it contained an �overstatement� about police bearing the �brunt� of the rioting; that the tone was �needlessly harsh�; that more context was necessary…. Yet a more pathetic collection of 317 words would be difficult to assemble. In his recent comments, Bennet called the Times note a misguided effort �to mollify people.� But Bennet didn�t write the bloated, italicized nostra culpa, according to informed sources�it was a committee product headed by the standards desk, with extensive involvement from Sulzberger himself, sources say. Sulzberger seemed disappointed upon being told that the post-publication fact-check hadn�t punctured the op-ed, according to a source involved in the process. The Erik Wemple Blog asked the Times for another example of an editor�s note apologizing for nonfactual issues. The Times didn�t answer that question, among others.
Which means that there is no other example.
A spokesperson issued this statement: �James is a talented journalist with deep integrity. We have great respect for him.�
Which, of course, is why they fired him.
The editor�s note teed up Bennet�s firing�technically, resignation�as editorial page editor. Media coverage of his departure noted that the op-ed was one of several storms under Bennet�s management…. The Cotton thing seemed like the last straw. Except, in hindsight, it wasn�t a straw at all. In initially sticking up for the Times�s role in publishing controversial fare, Sulzberger had it right. The paper had published an opinion by a U.S. senator (and possible presidential candidate) advocating a lawful act by the president.
Not only that, it was advocating an act that, at the time of Cotton's piece, was endorsed by a majority of Americans, as I point out in detail, below.
I've removed some throat-clearing at this point: Wemple still hasn't the courage to unapologetically defend free speech. You shouldn't need to agree with Cotton to defend his right to express his opinion any more than you should need to agree with Salman Rushdie to defend his right not to be stabbed multiple times.
Morning Consult…conducted two polls that essentially bracketed publication of the op-ed, and found that public support for military intervention dropped 13 percentage points�a decline driven mostly by Democrats. Cameron Easley, managing editor of Morning Consult�s newsroom, recently told the Erik Wemple Blog that he couldn�t rule out the possibility that the Cotton uproar accounted for some of the drop, but pointed to a decline in protest activity over the span of the two polls. �Perception of the threat had been downgraded significantly,� said Easley.
This is a good example―or should I say "bad" example?―of how to misleadingly report polling results. All we're told is that the poll numbers supporting military intervention dropped thirteen points without being told the actual numbers. As I wrote exactly a year ago, the majority of Americans supported Cotton's position2. Here are the relevant results from the polls referred to above:
According to the one preceeding the publication of Cotton's piece, 55% of adults supported "calling in the U.S. military to supplement city police forces"3. By the time of the second poll, only two to four days later, 42% of adults supported the same position4. I seriously doubt whether this change had anything to do with either Cotton's piece or any alleged decline in rioting in the span of less than a week. Instead, it's probably due to the usual vagaries of polls.
… The Erik Wemple Blog has asked about 30 Times staffers whether they still believe their �danger� tweets…. Not one of them replied with an on-the-record defense. …
You can't defend the indefensible. The claim that publishing Cotton's opinion placed any NYT staff at risk is ridiculous unless they were among the rioters engaging in violence, looting, and arson.
Our criticism of the Twitter outburst comes 875 days too late. Although the hollowness of the internal uproar against Bennet was immediately apparent, we responded with an evenhanded critique of the Times�s flip-flop, not the unapologetic defense of journalism that the situation required. Our posture was one of cowardice and midcareer risk management. With that, we pile one more regret onto a controversy littered with them.
Unless you're interested in the business side of the NYT, skip down to the section in the following article entitled "The View from James Bennet".
- Ben Smith, "Inside the identity crisis at The New York Times", Semafor, 10/18/2022
Times management has clawed back its ability to run conservative points of view without facing a newsroom revolt. But has anyone noticed? It�s hard to walk back high-profile grand gestures, like Bennet�s firing and the marketing of the 1619 Project, with quiet bureaucratic changes, columns and beat reporting.
One skeptic that the Times has an easy path back is Bennet himself. The former Opinion Editor and onetime heir apparent to run the Times spoke to me Saturday in his first on-the-record interview about the episode.
Bennet believes that Sulzberger, the publisher, �blew the opportunity to make clear that the New York Times doesn�t exist just to tell progressives how progressives should view reality. That was a huge mistake and a missed opportunity for him to show real strength,� he said. … Bennet, who now writes the Lexington column for The Economist, signed off on an editor�s note amid the controversy that the column �fell short of our standards and should not have been published.� �My regret is that editor�s note. My mistake there was trying to mollify people,� he said.
Don't try to mollify people calling for censorship; stand up for the principles of democracy, especially free speech.
The Times and its publisher, Bennet said, �want to have it both ways.� Sulzberger is �old school� in his belief in a neutral, heterodox publication. But �they want to have the applause and the welcome of the left, and now there�s the problem on top of that that they�ve signed up so many new subscribers in the last few years and the expectation of those subscribers is that the Times will be Mother Jones on steroids.� …
One thing that is clear in retrospect: while The Times sought to cast the firing into a question of performance, process, and Bennet�s ability to lead after the controversy, the move was widely perceived as a political gesture.
Because it was. It was an obvious attempt to mollify the mob attacking the NYT from both within and without. If the NYT doesn't come to understand that they are its enemies, it's doomed.
Notes:
- Tom Cotton, "Tom Cotton: Send In the Troops", The New York Times, 6/3/2020.
- See: Remembering the Sokal Hoax & Another Sign of The Times, 10/29/2021.
- "National Tracking Poll #2005131 ", Morning Consult, 5/31/2020-6/1/2020, p. 199.
- "National Tracking Poll #200613 ", Morning Consult, 6/3/2020-6/5/2020.
Disclaimer: I don't necessarily agree with everything in these articles, but I think they're worth reading as a whole. In abridging them, I have sometimes changed the paragraphing and rearranged the order of the excerpts in order to emphasize points.
October 22nd, 2022 (Permalink)
MOE-mentum1
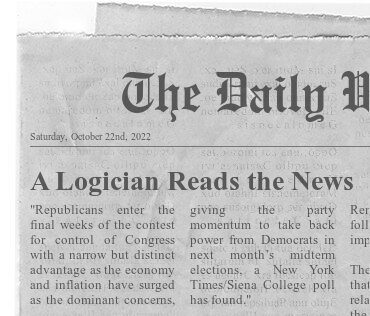
If you've been keeping up with this weblog, you may be getting sick and tired of reading about polling, and I'm getting a bit tired of writing about it, but I just have to comment on a recent poll that has gotten some attention. The New York Times (NYT) describes the relevant result as follows:
The biggest shift came from women who identified as independent voters. In September, they favored Democrats by 14 points. Now, independent women backed Republicans by 18 points�a striking swing….2
Naturally, Republicans are touting this result, with Fox News reporting:
Independent women voters are swinging aggressively toward Republican candidates in the final weeks of midterm election campaigning, according to new polling. A Monday poll from The New York Times and Siena College found that Republicans have an 11-point lead in the demographic, with 46% of Independent women saying they lean toward Republican candidates, while 35% preferred Democrats. The result shows a startling swing from the same poll conducted in September, which found Democrats having a 12-point lead among Independent women. That poll stated that 43% of the demographic preferred Democrats and 31% favored Republicans. The massive 23-point shift occurred over just a matter of weeks….3
A mystery of this poll is the difference between the results as reported by the NYT, the poll's sponsor, and Fox News, as quoted above. The NYT does not supply the actual percentages of independent women who lean towards one or the other party, just the spread between the percentages from month to month. Specifically, it claims that the women favored the Democrats by fourteen points last month, but now favor Republicans by eighteen. Fox, in contrast, gives the percentages, which show Democrats with only a twelve point lead last month, and Republicans leading by eleven this month.
Why the difference? The crosstabs supplied by the pollster don't disaggregate the numbers for independent women as far as I can see4, so I don't know where these numbers came from, or which is right. For the remainder of this entry, however, I'm going to use the numbers supplied by Fox since the NYT only gives the spread.
Apparently, some Democrats started freaking out over this result, leading The New Republic to publish an article with the title: "No, Democrats Should Not Be Freaking Out Over That Times Poll"5. I agree that Democrats don't need to freak out over this particular poll result, though not for most of the reasons given in the article, but it does mention the real reason in passing:
A Democrat would be forgiven for freaking out about the finding that there has been a major swing toward Republicans among independent women just a few months after the Dobbs decision. �You�re looking at 95 interviews with independent women. So you have a pretty big margin of error on this poll…,� [Ruth] Bernstein said.5
An important mathematical fact about polls is that the sample size and margin of error (MOE) are inversely related6. What that means is that the larger the sample, the smaller the MOE, and the smaller the sample, the larger the MOE. The MOE is essentially a measure of the precision of a poll, which means that the smaller it is, the more precise the poll results are, and the larger it is, the less precise they are. So, if you want more precise poll results, you need a larger sample.
The problem is that the sample size and the cost of polling in both time and money are directly related, that is, the larger the sample, the more time it takes to do the poll and the more it costs. This is why you seldom see national polls with a sample size of much more than a thousand respondents, which produces a MOE of approximately three percentage points. To reduce that MOE by a single percentage point requires more than doubling the sample size7, and thus probably doubling the time and money spent on the poll. So, most pollsters decide that it isn't worth it.
What is true of an entire sample is equally true of its subsamples―a "subsample" is simply a subset of the whole sample, and is itself a sample. A sample of a thousand people will have an MOE of approximately ±3 percentage points8. However, assuming that half of the sample are women, there will be 500 women in the sample. These 500 women are a subsample with a MOE of about ±4.5 percentage points. So, subsamples are themselves samples, and since they are smaller samples than the whole sample, they have larger MOEs. Unfortunately, journalists writing about polls and discussing the results for various subgroups seldom mention that the MOE is larger for such results, let alone actually supplying that larger MOE.
Now with this under our belt, let's return to the example. The sample size of the NYT/Siena survey was 792 with a reported MOE of ±4.1%9. So, the sample for this poll is smaller than usual for a national poll, and the MOE accordingly larger. The subsample of women is roughly half that, specifically, 376, and the subsample of independents only 233. If we assume that independent voters are roughly half-and-half male and female, then there would be about 116 independent women surveyed. The MOE for a sample of this size is a little over ±9 percentage points. I don't know where Ruth Bernstein, quoted above, got her information, but she claimed that there were 95 independent women in the sample, for a MOE of about ten points. The crosstabs of the poll indicate that 23% of the female respondents identify as "Independent", which is about 86 women, for a MOE of almost eleven points. So, however many women were actually in this subsample, it's clear that its MOE is substantial.
Assuming that Bernstein is correct, and using a ten-point MOE to convert the point estimates into confidence intervals results in the poll showing 36-56% of independent women leaning Republican, and 25-45% leaning Democrat. Given the large overlap between these intervals, there's nothing here to get excited about. That's not to say that the results don't indicate a trend toward Republican candidates, but it's not likely to be a "massive" shift, simply because massive shifts are uncommon. The results of this poll for such a small subsample are just too imprecise to support such an unlikely conclusion.
While we're at it, let's look at the ways that the difference between this month's and last month's polls was reported. As quoted above, Fox News referred to it as a "massive 23-point shift" in support10, which makes it sound as though 23 percentage points of independent women shifted from leaning Democrat to leaning Republican. If this had actually happened, though, the results would have looked even more massive, leaving only twenty points supporting Democrats and 54 points leaning Republican.
How did the Fox reporter come up with the number 23? Apparently, he added the 12 point lead that Democrats had last month to the current 11 point lead of Republicans, but it's misleading to call this a "shift". Rather, this is the "spread" between the Democrats' former lead and the Republicans' current one.
To understand the apparent "shift" in support, we need to find out how many independent women would have to change from leaning Democrat to Republican between last month and this in order to see these numbers. Whenever someone switches from supporting the Democrats to the Republicans, the Democrats lose one point and the Republicans gain one, which means that the spread between the two parties increases by two points for every such change.
According to the survey, the Democrats lost eight points while the Republicans gained fifteen between September and October. Thus, even if all eight Democratic points shifted to the Republicans, there is still a seven point deficit. Since the total points of the two parties this month equals only 81, there are nineteen points that do not lean to either party. Last month, 26 points leaned to neither party, and the difference between months is exactly the seven missing points.
Rather than a 23 point shift, what would account for these numbers is eight points moving from the Democrat to the Republican column together with seven points from the non-leaners. These are large shifts, but not "massive" ones, and both are within the MOE. In any case, it's not an unbelievable change as we approach election day, unlike a 23 point shift.
So, no, Democrats needn't "freak out" about this particular poll result, though some concern about the general trend of polling respondents away from the Democratic party towards Republicans seems warranted.
Notes:
- The quote in the newspaper clipping is from the source in the next note.
- Shane Goldmacher, "Republicans Gain Edge as Voters Worry About Economy, Times/Siena Poll Finds", The New York Times, 10/17/2022.
- Anders Hagstrom, "Independent women flocking to GOP in final days before midterms: Poll", Fox News, 10/18/2022.
- See: "New York Times/Siena College Poll Conducted by the Siena College Research Institute", Siena College, accessed: 10/21/2022.
- Daniel Strauss , "No, Democrats Should Not Be Freaking Out Over That Times Poll", The New Republic, 10/18/2022.
- For a good brief explanation of this point, see question four in the following: Andrew Mercer, "5 key things to know about the margin of error in election polls", Pew Research Center, 9/8/2016.
- To be more precise myself, a sample size of 2,400 will produce a MOE of two percentage points, give or take.
- I estimated all MOEs in this entry using the formula: 1/√n, for sample size n, which gives a good estimate of the MOE at the 95% confidence level. See: Jessica M. Utts, Seeing Through Statistics (2nd edition, 1999), p. 53.
- I get about ±3.5, but according to the crosstabs, the reported MOE "accounts for the survey's design effect, a measure of the loss of statistical power due to weighting." See note 4, above.
- Some news media reported an even more massive "swing" of 32 points based on the NYT's numbers, for instance: Isaac Schorr, "Independent Women Swing Hard Toward GOP Despite Democrats� Abortion Push", National Review, 10/17/2022. Since the NYT did not supply the percentages of support for the parties, there's no way to determine how many percentage points would've had to shift from Democrat to Republican to account for a 32 point spread.

October 20th, 2022 (Permalink)
What are polls good for?
Comment: Continuing this month's theme, our new book is about public opinion polling. It's certainly very timely with the midterm election, a major test for the pollsters, coming up soon.
Title: Strength in Numbers
Subtitle: How Polls Work and Why We Need Them
Quote: "If you have heard anything about public opinion polling, it is probably about the industry's failures. … Take the results of the 2016 election. On average, polls predicted that Hillary Clinton would win the popular vote by three or four percentage points…. A new generation of data-driven polling experts gave forecasts with precise, mathematical confidence in her victory. But she lost in five key states where the polls consistently had her leading, and only wound up winning the popular vote by two points. The press and the public derided polls, and the pollsters, as inaccurate, misleading, and increasingly irrelevant."1
Author: G. Elliott Morris
Comment: Morris is a "data journalist", whatever that is, for The Economist magazine. I'm not familiar with his work for the magazine, and this is his first book2.
Summary: As best I can judge from what little I've read and the table of contents, the book appears to be a history of polling in the first half, and a defense of the practice in the second.
General Comment: I haven't finished reading this book yet―in fact, I just started―but it appears that Morris' defense of polling may be based on the dubious notion of a "will of the people". He doesn't seem to be defending polling on the grounds that it is accurate at predicting election results, but that it can be used to measure what we the public want, and then government can give it to us "good and hard", to quote Mencken3.
One problem with such issues polling is that we have no direct way of measuring its accuracy. We can compare one poll with other polls, but this is not a measure of accuracy, but of precision4. If there are systematic biases, as may be the case with recent election polling, most of the polls will be off in the same direction. If election polling were just a way of feeding horse race journalism, we should get rid of it, but it's our only way of testing polls against reality. So, at the very least, if our main interest is in issues, as opposed to election forecasting, then we'll still need the forecasting to calibrate the issues polling.
I may have more to say on this topic if, after I've finished it, I decide the book is worth reviewing.
The Blurbs: The book is positively blurbed by the statistician Andrew Gelman, so it should be at least technically accurate.
The Reviews: The Guardian has a mostly positive review5.
Date: 2022
Disclaimer: As mentioned, this is a new book and I haven't finished reading it, so can't review or recommend it. However, its topic interests me, and may also interest Fallacy Files readers.
Notes:
- "Introduction".
- "Acknowledgments".
- "Democracy is the theory that the common people know what they want, and deserve to get it good and hard."―H. L. Mencken, A Little Book in C Major (1916).
- For an explanation of the distinction between accuracy and precision, see the New Book entry: The Signal in the Noise, 6/2/2022.
- Sam Freedman, "Strength in Numbers by G Elliot Morris review�why polls matter", The Guardian, 8/10/2022.

October 15th, 2022 (Permalink)
Polling All Pundits
Midterm elections in the United States are less than a month away: the eighth of next month, to be exact. As a result, there have been a number of recent think pieces by pundits wondering whether the polls will be as wrong this year as they were two years ago.
The latest forecast by Nate Silver's 538 site, based on an aggregation of the polls, gives a 77% probability that the Democrats will maintain control of the Senate, but a 64% likelihood that the Republicans will take control of the House of Representatives1. In contrast, the current Real Clear Politics (RCP) projection, also based on aggregating polls, is that the Republican party will pick up two Senate seats, giving it control of the Senate2. In addition, RCP shows the GOP winning at least 220 seats in the House of Representatives, which is sufficient for control of that body3. So, both major poll aggregators agree that the Republicans will probably take control of the House, but disagree over which party will control the Senate.
The big polling news of two years ago was the occurrence of "errors of unusual magnitude" in the polls and forecasts based on them4, so it's only natural to wonder whether we may be in for a re-run this year. In this entry, I'm going to examine and evaluate what those pundits who write about polls think is going to happen next month. Will there be a bias in this year's polls similar to that in 2020?
Nate Cohn, The New York Times' polling guru, seems to have been the first pundit to publicly raise this question5:
…Early in the 2020 cycle, we noticed that Joe Biden seemed to be outperforming Mrs. Clinton in the same places where the polls overestimated her four years earlier. That pattern didn�t necessarily mean the polls would be wrong…but it was a warning sign. That warning sign is flashing again: Democratic Senate candidates are outrunning expectations in the same places where the polls overestimated Mr. Biden in 2020 and Mrs. Clinton in 2016. … The more the polls overestimated Mr. Biden last time, the better Democrats seem to be doing relative to expectations. And conversely, Democrats are posting less impressive numbers in some of the states where the polls were fairly accurate two years ago, like Georgia. … It raises the possibility that the apparent Democratic strength…is a mirage�an artifact of persistent and unaddressed biases in survey research.If the polls are wrong yet again, it will not be hard to explain. Most pollsters haven�t made significant methodological changes since the last election. The major polling community post-mortem declared that it was �impossible� to definitively ascertain what went wrong in the 2020 election.
The pattern of Democratic strength isn�t the only sign that the polls might still be off in similar ways. …[S]ome pollsters have said they�re seeing the familiar signs of nonresponse bias�when people who don�t respond to a poll are meaningfully different from those who participate�creeping back into their surveys. …
None of this means the polls are destined to be as wrong as they were in 2020. Some of the polling challenges in 2020 might have since subsided, such as the greater likelihood that liberals were at home (and thus more likely to take polls) during the pandemic. And historically, it has been hard to anticipate polling error simply by looking at the error from the previous cycle. … But the pattern is worth taking seriously after what happened two years ago. … If the polls are just as wrong as they were in 2020, the race for the Senate looks very different. …[T]he race for Senate control would be extremely competitive. Republican control of the House would seem to be a foregone conclusion.
So, Cohn doesn't answer the question he raises, but does warn that a repeat of 2020, perhaps with a smaller level of bias, cannot be ruled out. The same day that Cohn published his warning another Times writer, David Leonhardt, responded6:
The final polls in the 2020 presidential election overstated Joe Biden�s strength, especially in a handful of states. … In each of these states�and some others�pollsters failed to reach a representative sample of voters. One factor seems to be that Republican voters are more skeptical of mainstream institutions and are less willing to respond to a survey. If that�s true, polls will often understate Republican support, until pollsters figure out how to fix the problem.
This is the so-called "shy Trump voter" hypothesis, or the "Trump effect"7.
This possibility offers reason to wonder whether Democrats are really doing as well in the midterm elections as the conventional wisdom holds. Recent polls suggest that Democrats are favored to keep control of the Senate narrowly, while losing control of the House, also narrowly. But the Democrats� strength in the Senate campaign depends partly on their strength in some of the same states where polls exaggerated Democratic support two years ago…. Nate Cohn, The Times�s chief political analyst, calls it �a warning sign��for both the Democratic Party and for the polls. …Or is 2022 different? Nate is also careful to acknowledge what he doesn�t know, and he emphasizes that the polls may not be wrong this year in the same way that they were wrong in 2020. It�s even possible that pollsters are understating Democratic support this year by searching too hard for Republican voters in an effort to avoid repeating recent mistakes.
Perhaps so, but Cohn claimed that most pollsters had not made any significant changes in their practices, partly because the post-mortems were not able to identify the cause of the bias. As I claimed in an earlier entry7, every explanation seemed to be ruled out except for a systematic failure to poll a representative sample of voters. Specifically, this means that the polls are missing enough Trump voters, Republicans, or conservatives to bias the sample towards Democrats.
There are still some big mysteries about the polls� recent tendency to underestimate Republican support. … There is also some uncertainty about whether the problem is as big when Trump is not on the ballot�and he is obviously not running for office this year.
This, of course, is the biggest problem facing the use of this election as a natural experiment testing the Trump effect hypothesis. If there appears to be no significant effect in November, it will be easy to dismiss it as a result of Trump's absence.
So, Leonhardt seems to be suggesting that Cohn was crying "wolf", and that the Democratic readers of the Times needn't be too worried about a 2020 replay, but he can't completely dismiss the possibility.
Also the same day, the non-Times writer, Ed Kilgore, responded to Cohn's article8:
[T]he polls are telling us that Democrats are doing nearly as well as Hillary Clinton was in the stretch run of the 2016 presidential race; the most wildly optimistic midterms forecasts approach the landslide the polls told us Joe Biden was likely to win in 2020. In other words, a lot of Democratic optimism is based on the assumption that 2022 polls are more accurate than 2016 or 2020 polls. And as Nate Cohn of the New York Times points out, that assumption could be wrong once again…. But it remains unclear why these polling errors occurred in the first place. After 2016, the prevailing wisdom was that pollsters were undersampling the white working-class voters where Trump was making big gains over past Republican candidates. Many pollsters changed their methodologies to account for that problem, leaving analysts conflicted and/or baffled by the even larger polling errors of 2020. … A postmortem by five Democratic campaign pollsters reached no clear conclusion, other than to note that polling errors were most extreme in red states. One entirely plausible theory was that Donald Trump's endless demonization of…all polls in which he was not doing well led many of his supporters to disproportionately refuse to participate in surveys…. But Trump is not on any ballot…in 2022, and it�s worth noting that polling in 2018�the last midterm when Trump was in office�was quite accurate. In that year, moreover, Democrats overperformed their standing in the polls…. If polls these days systemically underestimate Republican voting strength, that shouldn�t have happened. …In sum, it�s hard to predict whether the polls will be wrong in November and if so, which way the errors will cut. The contrarian Nate Cohn is clearly trying to throw cold water on Democratic optimism by citing the 2016�2020 polling error that underestimated the Republican vote in certain states that are holding crucial 2022 Senate contests. And he may be right if the incessant and ever-growing distrust among Republicans of all election institutions…that we�ve seen since November of 2020 means the GOP base will now routinely shirk polls faster than pollsters can adjust for their absence in the samples. The doubts we have about polls reflect broader doubts about the "Trump effect" in 2022.
Like Leonhardt, Kilgore is trying to downplay Cohn's warning by, among other things, calling him a "contrarian", which suggests that Cohn takes positions just to be contrary. However, also like Leonhardt, he doesn't deny that Cohn might well be right.
A few days later, Nate Silver jumped into the debate9:
…I've observed a[n]…increase in concern among liberals that the polls might overestimate Democrats' position again, as they did in 2016 and 2020. Even among commenters who are analyzing the race from an arm's-length distance, there sometimes seems to be a presumption that the polls will be biased toward Democrats. …Here, I�m going to present something of a rebuttal…to the presumption I often see in discussion about polling that polling bias is predictable and necessarily favors Democrats. My contention is that while the polls could have another bad year, it�s hard to know right now whether that bias will benefit Democrats or Republicans. People�s guesses about this are often wrong. … What I resist…is the implication that it can be presumed that the polls have a predictable, persistent, systematic bias toward Democrats. …I'm skeptical. Here are seven reasons why:
- Polling bias hasn�t been predictable historically Our historical database of polls shows that there�s not much in the way of consistent polling bias.
- Pollsters have a strong incentive to be unbiased …
- The way polling averages weight pollsters changes Even if pollsters don�t change their methods, the market will change the polling landscape on its own, at least to some degree. Pollsters who performed well in previous elections will get more business, and those who performed poorly will lose it. …
This is a little obscure, but Silver means that the way he and other poll aggregators weigh the pollsters and weight their polls will change based on how well the pollsters have done in the past. Thus, 538 will be giving more weight to Republican-leaning polls, which may tend to compensate for a pro-Democrat bias.
- Polls haven�t had a Democratic bias in elections without Trump on the ballot … I tend not to buy the so-called �shy Trump� theory, or that voters are reluctant to state their preference for Trump. But it may nonetheless be hard to reach Trump voters, who may be more socially isolated, or who may be irregular voters who are screened out by likely voter models.
This latter possibility is the version of the Trump effect that seems to be the last hypothesis standing, that is, that some fraction of current Republican voters are more likely to vote than they are to answer surveys, and that whatever weighting the pollsters do to take this into account, if any, simply isn't sufficient.
- Polls have been unbiased or underestimated Democrats in recent elections in 2022 …
Silver seems to have forgotten the New Jersey governor's election last year10, where the incumbent Democrat won by 3.2 percentage points11, but the RCP average put him ahead of the Republican by 7.8 percentage points. The difference of 4.6 points is right in line with the hypothetical Trump effect.
- Pollsters have a semi-decent excuse for 2020: COVID-19 …Democrats were more likely to be in jurisdictions that implemented stay-at-home orders, and liberals were otherwise more likely to voluntarily limit their social interactions. Having more time at home on their hands, they may have been more likely to respond to polls. That�s less of a concern this year, with few voters treating COVID-19 as a high priority and few government restrictions in place.
- People are too hung up on polls from 2016 and 2020 …
…[T]here are some decent reasons to suspect that Democrats won�t perform as well in November as they would in an election right now. Still, I�ll stick to my usual advice: Prepare for the polls to be wrong�in either direction.
Well, that's some defense of polls! With friends like that, polling doesn't need any enemies.
Finally, Andrew Prokop of Vox analysed the state of the debate12:
It just seems to keep on happening―Democrats get their hopes up from rosy-looking polls, but they get a rude awakening when votes are tallied on election night. …[N]ow, as the 2022 midterms are drawing nearer, polls show Democrats performing surprisingly decently―pointing toward a close election rather than the long-expected GOP wave. Unless, of course, the polls are just underestimating Republicans again. …[S]ure, polls can be wrong. The debate here is over a different question: Have polls so persistently underestimated Republican candidates of late that it�s simple common sense to suspect it's happening again? Or is the recent polling error tougher to generalize about, meaning that we should be more hesitant to suspect a bias against the GOP, and that Democrats maybe shouldn't feel so anxious?My own view is that it makes all the sense in the world to be deeply skeptical of polls showing big Democratic leads in states like Wisconsin and Ohio, where polls have consistently greatly overestimated Democrats across several election cycles. But the picture is less clear in other states, where polling error hasn't been so clear or consistent. I wouldn't blindly "trust" those polls, but I wouldn't assume they're likely wrong, either.
So, Prokop is throwing cold water over the cold water throwers.
…[I]n 2020, polls had their worst performance in decades, because they significantly overestimated Democrats' margins at nearly every level―presidential popular vote, presidential swing states, Senate swing states, and the House―by an average of nearly 5 points.
I'm making the conservative assumption that the average Trump effect is only four percentage points in favor of the Democrats.
If you look at Senate polling of competitive contests from 2014 to 2020, and swing state presidential polling in 2016 and 2020, the pattern of bias seems quite plain: Polling underestimated Republicans far more often than Democrats in these contests, which stretch across several cycles at this point. Often, these errors were most pronounced in certain states or regions, such as Rust Belt states or very red states. So Cohn sees "warning signs" that recent polls may be overestimating Democrats in those same states, an "artifact of persistent and unaddressed biases in survey research."Silver takes a broader view, incorporating polling nationally, of governor�s races, and of off-year and special elections into his analysis, and concludes that the picture looks more mixed. He argues that polls have either been pretty close or even underestimated Democrats in various elections in 2017, 2021, and 2022…. He views 2018 in particular as a mixed bag, not demonstrating a �systematic Democratic bias.� And he posits that perhaps �Republicans benefit from higher turnout only when Trump himself is on the ballot,� meaning that 2016 and 2020 might be the wrong elections to focus on when thinking about this year.
I have a different interpretation of polls� performance in 2018 than Silver, though. According to his numbers, polling averages underestimated Democrats by about 1 point on average in the House and in governor�s races, and there was no partisan bias in Senate polls on average that year. But there�s a catch: The Senate map that year had an unusually large amount of contests in solidly blue states, none of which proved to be competitive. Democrats outperformed polls in nearly all of those contests. Yet if we look at 2018�s actually competitive races�which that year were in purple and red states�most Democratic candidates underperformed their polls, and often by quite a lot.
The final margin was more than 3 points more unfavorable to the Democrat than FiveThirtyEight's final polling averages in Florida, West Virginia, Michigan, Ohio, Tennessee, Missouri, and Indiana. There was only one competitive state�Nevada�in which the Democrat outperformed polls by more than 3 points. So, for the purposes of someone trying to figure out which way the Senate would tip, the polls did functionally underestimate Republicans in 2018 too.
The general consensus seems to be that either the polls will underestimate the Republican vote, or they'll overestimate it, or they'll get it just right. Who knows? None of the pundits seems to be willing to make a prediction as to which way it will go. Anything is possible!
I'm not predicting anything for this election. However, the Trump effect hypothesis does predict that some combination of Trump supporters, Republicans, or conservatives are not being polled in quantities representative of their share in the voting population. I and others have quantified this missing group as representing on average approximately four percentage points in polls7, which means that a Democratic candidate must lead by more than four percentage points to win the election.
Unfortunately for the test, Trump is not himself on the ballot, so that a failure of the election results to support the hypothesis will not be a clear refutation of it. A true test of the hypothesis won't be possible until 2024, assuming that Trump runs for president again. However, if the results do support the hypothesis then we'll need to take it into consideration two years from now.
Notes:
- "Election Forecast", 538, 10/14/2022. These percentages are based on the so-called Lite model, which simply aggregates polls.
- "Battle for the Senate―RCP Projection", Real Clear Politics, accessed: 10/15/2022.
- "Battle for the House 2022", Real Clear Politics, accessed: 10/15/2022.
- See: Errors of Unusual Magnitude, 7/19/2021.
- Nate Cohn, "Yes, the Polling Warning Signs Are Flashing Again", The New York Times, 9/12/2022. Paragraphing suppressed on this and other quotes.
- David Leonhardt, "Are the Polls Wrong Again?", The New York Times, 9/12/2022.
- The Trump Effect, 11/1/2021.
- Ed Kilgore, "Will the Polls Be Wrong Again in 2022?", New York Magazine, 9/12/2022.
- Nate Silver, "Will the Polls Overestimate Democrats Again?", 538, 9/16/2022.
- See: Post Mortem, 11/11/2020.
- "New Jersey Governor", CNN, 12/3/2021.
- Andrew Prokop, "How the polls might be wrong (again) this year", Vox, 9/23/2022.

October 8th, 2022 (Permalink)
The Texas Chainsaw Sharpshooter Massacre Fallacy
Just in time for Halloween, I've extensively revised and expanded the entry for the Texas sharpshooter fallacy, adding a reader response in the process. I thought I'd mention it in case you might want to take a look at the shiny new entry. It has that new entry smell!
October 2nd, 2022 (Permalink)
Shear or Sheer?
A book I just read includes the following sentence: "In recent years, the greatest growth in the shear quantity of statistical indicators has been in the field of education.1" "To shear" is a verb that means cutting the wool from a sheep or, more generally, cutting hair close to the skin, or close cutting of some sort2. However, it's an adjective rather than a verb in the above sentence. As a noun, it has a technical meaning in geology, and it can be used as an adjective, as in, "shear force" and "shear strength", but not, as far as I know, "shear quantity". Anyway, this meaning wouldn't make sense in the above sentence: how would a technical geological term apply to educational statistics?
In contrast, "sheer" is an adjective with a wide range of meanings depending on the noun it modifies: "complete", "unqualified", "thorough", or "utter", as in "sheer nonsense" or "sheer luck"; "steep", as in "sheer slope"; or "thin", as in "sheer fabric"3. It's hard to see what connects these different meanings, but it seems to be extremity; for instance, a sheer slope is extremely slanted, a sheer fabric is as thin as you can get, and sheer nonsense is thoroughly nonsensical. A type of extremity is purity or lack of dilution, so that sheer foolishness is pure foolishness undiluted by even a drop of sense.
However, some uses of "sheer" seem to serve simply as emphasis, that is, as a way of underlining a word or putting it in italics. The author of the book seems to have used "sheer" in this way, so that we could paraphrase the sentence: "The greatest growth in the quantity of statistical indicators has been in the field of education."
Since both are proper English words, a sheer spell-checking program will not shear the mistake from your prose. However, given that one of the two spellings is usually a verb, while the other is an adjective, a program that checks grammar may mark the error. My old copy of Microsoft Word, when given the example sentence, flagged the word "shear" as a "Possible Word Choice Error", and suggested "sheer" as a correction. Well done! In comparison, out of several free online spell-checking programs I checked, only one caught it.
In sum, if you habitually use a spell-checking program, you might want to check it to see if it will catch this error. Either that, or file it away in that spell-checker in your head called a "brain".
Notes:
- Gary M. Klass, Just Plain Data Analysis: Finding, Presenting, and Interpreting Social Science Data (2008), p. xvii.
- "Shear", Cambridge Dictionary, accessed: 10/1/2022.
- "Sheer", Cambridge Dictionary, accessed: 10/1/2022.
