Previous Month | RSS/XML | Current | Next Month
WEBLOG
July 31st, 2014 (Permalink)
Check it Out, Too
I have a review in Notre Dame Philosophical Reviews of Emotive Language in Argumentation, a book by philosopher Douglas Walton and Fabrizio Macagno.
Source: Gary Curtis, "Review of Emotive Language in Argumentation", Notre Dame Philosophical Reviews, 7/31/2014
July 30th, 2014 (Permalink)
Fact Check it Out
Mike Rothschild of Skeptoid has fact-checked claims linking Monsanto, flouridation, aspartame, and microwave ovens to the Nazis―see the Source, below. Check it out. I would just add that in addition to not checking out factually, such claims don't check out logically, as Rothschild briefly alludes to at the start of the article:
The lazy shorthand for calling something or someone evil is to compare them to the Nazis. It’s a cheap and easily-understood way of demonizing something you personally don’t like. Call it guilt by association….
Or, call it "the Hitler card", more specifically―see the Fallacy, below. And now I'm going to heat up some flouridated water in my microwave oven and sweeten it with aspartame―after steeping a tea bag in it, of course.
Source: Mike Rothschild, "Stop Comparing Everything You Don’t Like to the Nazis", Skeptoid, 7/29/2014
Fallacy: The Hitler Card
July 26th 2014 (Permalink)
A Prize Puzzle for a Rainy Day
It looks to be a rainy day in Centerville. Dark clouds block the sun and distant thunder rolls. The weather girl on TV gives a 90% chance of precipitation. The following facts are true of those hardy Centervillians who decide to brave the weather:
- 20% of Centervillians who go outside do not wear a hat.
- The same percentage of Centervillians wear only a hat―of course, they wear other clothes, but nothing specifically to ward off rain―as the percentage of those who carry an umbrella and wear galoshes but no hat.
- 25% of Centervillians wear both a hat and galoshes but do not carry an umbrella.
- 35% of Centervillians do not wear galoshes outside.
- The percentage of Centervillians who wear only a hat outside is twice that of the percentage who wear only galoshes.
- 40% of Centervillians who venture outside do not carry an umbrella.
Update (8/23/2014): I should have stated above that no Centervillian is so foolish as to venture outside on a day with such a high chance of precipitation without at least one item of rain apparel. Thanks to Louis for pointing out this omission.
What percentage of Centervillians are extremely careful and wear a hat and galoshes as well as carry an umbrella?
If you can answer the above question, please email me the solution. The first person to submit the correct solution will receive a coupon for a free copy of cognitive scientist Luc P. Beaudoin's new book Cognitive Productivity: The Art and Science of Using Knowledge to Become Profoundly Effective, which is an e-book that you can download in a number of formats for different types of reader. Any runners-up will receive an honorable mention on this honorable weblog.
Update (7/27/2014): Congratulations to Cameron Hunter, who was the first person to submit the correct answer!
Solution to a Prize Puzzle for a Rainy Day
Acknowledgment: Thanks, again, to Luc P. Beaudoin for supplying the prize for this contest.
July 21st 2014 (Permalink)
Wikipedia Watch
Wikipediocracy has a good article on the unreliability of Wikipedia―see the Source, below. There are two points of particular importance made by the article, both of which I've mentioned in previous watches―see the list of watches, below:
- An important concern about Wikipedia is the danger of circular citation―what the article calls "citogenesis":
The process whereby spurious information added to Wikipedia is blindly copied by other publications that are then added to the Wikipedia article as sources, cementing the spurious information in place (after all, it now has a footnote!)….
Theoretically, claims are not supposed to be added to Wikipedia entries without a citation to an external source, but of course in reality it happens. Subsequently, many external sources will copy the unsourced claim from Wikipedia. Now, the originally unsourced claim can be cited to an external source!
- I've argued previously that Wikipedia should not be used as an encyclopedia, but as a research guide similar to a search engine. For this reason, you should never cite Wikipedia as a source for information for the same reason that you would not cite Bing or Google. Wikipedia is often a better way to find information on a topic than a search engine since it's organized by people rather than an algorithm, but it lacks the reliability of a proper encyclopedia:
This is Wikipedia in a nutshell: genuine research mixed with completely unreliable information in such a way that looking at any Wikipedia article the reader never knows what is correct and what is made up.
The article also mentions Charles Seife's new book―see the previous entry. Check it out.
Source: Andreas Kolbe, "How pranks, hoaxes and manipulation undermine the reliability of Wikipedia", Wikipediocracy, 7/20/2014
Previous Wikipedia Watches: 6/30/2008, 10/22/2008, 1/25/2009, 3/22/2009, 5/16/2009, 7/21/2009, 1/9/2013, 10/24/2013, 5/2/2014
July 19th 2014 (Permalink)
New Book: Virtual Unreality
Charles Seife, author of Proofiness, has a new book entitled Virtual Unreality: Just Because the Internet Told You, How Do You Know It’s True?. I guess the subtitle pretty much tells you what it's about.
Source: Clara Moskowitz, "Book Review: Virtual Unreality", Scientific American, 6/1/2014. Added 7/25/2014: I originally forgot to include a link to this short book review, which was my source for the entry.
Resources:
- New Book: Proofiness, 8/26/2010
- In the Mail: Proofiness, 9/3/2010
July 3rd 2014 (Permalink)
Strike Three…You're Out!
The final strike against the Slate article discussed in the two previous entries is its tabloid-style headline:
Do Americans Think Corporations Have the Right to Religious Freedom?
We did a survey, and the answer is no.
As explained in the previous entries, this was not shown by the survey. Putting aside the problems with how the poll's sample was selected and its size, the most it showed is that Americans think that the right to religious freedom of individuals is more important than that of corporations, not that the latter have no such right at all. The article itself, while occasionally exaggerating the poll's results, was more accurately written―see the quote in the first entry for this month, below. The language used in the body of the article is carefully and consistently comparative, since the most that the poll shows is greater support for the religious freedom of individuals than of groups.
Many people are likely to read such a headline and not bother with the article itself, thus getting a false impression about what it shows. Even those who read the entire article may be misled into misinterpreting it along the lines suggested by the headline. Perhaps the headline writer misunderstood the poll results, or the editors at Slate are willing to write false but provocative headlines in order to trick people into reading their articles.
Update (7/4/2014): I've revised the second paragraph to remove a silly, unintended implication.
July 2nd 2014 (Permalink)
Strike Two…
The same Slate article discussed in yesterday's entry also provides a good test of your understanding of the pitfalls of charts and graphs. Look at the chart below, which accompanies the article and reports the poll results. Using the terminology given in the lessons on charts and graphs from last year―see the links, below―can you identify what type of chart this is? See below the chart for the answer.
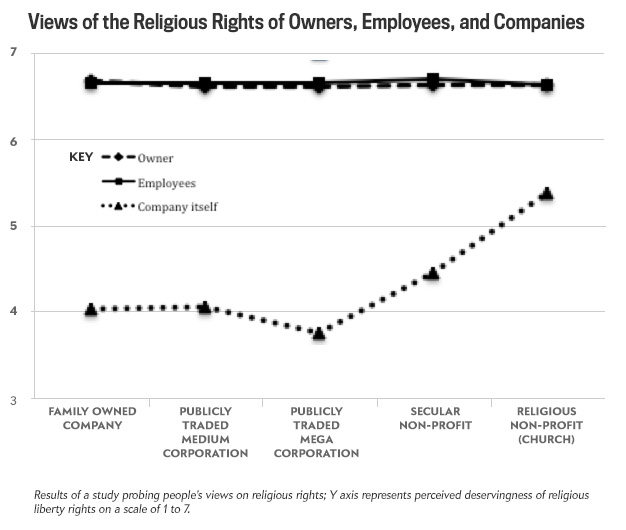
This is a gee-whiz line graph―see Lesson 1, below. The y-axis doesn't start at 1, which is the lowest number in the scale, thus visually exaggerating the differences between the results for people and businesses. Worse, the graph does not have a broken y-axis near the x-axis, which is standard practice in chartmaking when cutting off the bottom of a graph. One might excuse the truncation, but not failing to include a visual sign of it, for that is charting malpractice.
As I pointed out in the previous entry, it's not at all clear what the numbers are supposed to mean in this survey. Someone just glancing at the graph might get the false impression that, because the line for groups is close to the bottom of the chart, that must mean that most people do not believe that groups deserve "religious liberty rights". However, all of the results but one are at or above 4 on a scale of 1 to 7, which might just as well indicate differing degrees of support for such rights.
Lessons in Charts & Graphs: 1, 2, 3, 4, 5, 6, 7, 8, 9
July 1st 2014 (Permalink)
Strike One…
A current article in Slate is a good test of your understanding of the pitfalls of polling and its reporting. See if you can figure out what, if anything, is wrong with this poll before I discuss it. Here's a brief synopsis of the article, though I suggest reading the whole thing, which isn't long―see the Source linked below:
The Supreme Court ruled 5–4 on Monday that Hobby Lobby, a family-owned hardware retail chain, has a right to religious freedom. … What does the American public think about religious rights for corporations? Over the past few months, we’ve conducted a series of surveys, delivered online to more than 300 people across the country between the ages of 18 and 76. … To understand how people think about corporate rights, we asked how important they thought the religious liberty right of a company’s owner, its employees, and the company itself, on a scale of 1 to 7. … Our respondents consistently agree that religious liberty is important for both individual employees and owners. In contrast, respondents were significantly and consistently less willing to grant the same scope of protection to all the for-profit companies we presented them. …[P]eople did distinguish between for-profit and non-profit organizations, deeming the latter to be more deserving of religious liberty rights. But even when the religious liberty of a church is at stake, people viewed it as much less deserving of religious rights than its employees and officers.
There are several problems with this poll or the article that reports it:
- This was an online poll, and most such polls use self-selected samples, that is, they are not "scientific" polls that use random samples―for more on the distinction between self-selected and scientific surveys, see the Resource below. The article itself doesn't explain how the sample was taken, nor can I find a link to a longer report on the poll that would do so. In the absence of some assurance that the sample was taken randomly, I think we have to assume that it was not.
- There is no mention in the article of a margin of error (MoE) for the poll, which violates the usual American journalistic standard to report the MoE. Since MoEs can only be calculated for surveys based on random samples, this is further evidence that the sample was probably self-selected. However, even if the sample was taken randomly, 300 respondents is a small sample for a public opinion poll, which typically will have one more than three times as large. Assuming a random sample and a confidence level of 95%, the MoE would be around five and a half percentage points.
- Unfortunately, even assuming a random sample, it's impossible to use the MoE to evaluate the poll since none of the results are reported as percentages. Instead, the results are numbers on a scale from 1 to 7, which are presumably averages of the answers given by respondents. However, as far as we can tell, it may be that none of the differences reported by the poll are statistically significant. See the Resource, below, for more on MoE errors.
- Finally, the poll asked respondents to rate the religious rights of people and companies on a numerical scale, but what do the numbers mean? Presumably, a "1" would mean that respondents think that the person or company has no rights, and a "7" would mean that they do, but what does a "4" or "5" mean? Did the survey itself explain the meanings of the numbers? If so, then the article is poorly reported.
In sum, there's no reason to believe the sample used in this survey is representative of the American public, and no evidence that the differences in results are statistically significant. So, as far as we can tell from this article, the poll is worthless.
Source: Moran Cerf, Aziz Huq & Avital Mentovich, "Do Americans Think Corporations Have the Right to Religious Freedom?", Slate, 7/1/2014
Resource: How to Read a Poll